Arduino Thermistor Theory, Calibration, and Experiment
Blog Post Index
PCBGOGO - Manufacturer Sponsor for this project
Thermistor, whose name is derived from a combination of thermal and resistor, is a temperature sensing device that registers changes in internal resistance as a function of temperature. Thermistors are often chosen over thermocouples because they are more accurate, have a shorter response time, and are generally cheaper. For most applications, thermistors are the smart and easy selection for temperature sensing below 300 degrees Celsius [read more about the difference between thermistor and thermocouple here]. In our case, we will be using a Negative Temperature Coefficient (NTC) thermistor, where the resistance decreases as the temperature increases. NTC thermistors are most common in commercial products that operate in the tens of degrees like thermostats, toasters, and even 3-D printers. An NTC 3950 100k thermistor will be used, which is designed for 100kOhm resistance at 25 degrees Celsius. This tutorial will introduce methods for relating resistance to temperature by fitting factory calibration data. The performance of the thermistor will also be evaluated using an Arduino board and a simple Newton’s law of cooling experiment.

Zoomed-in photo of an NTC 3950 100k Thermistor. The glass bead design can be seen at the end of the exposed dual wire.
I will be using an NTC 3950 100k thermistor as mentioned above, and it will serve as the primary component used in this tutorial. Additionally, an Arduino board will be needed along with a DHT22 temperature sensor if the user is planning to follow along completely with this experiment. I have added a parts list below with some affiliate link from amazon:

Thermistors can be approximated by assuming a third-order function called the Steinhart-Hart approximation [source on thermistor calibration]:
where T is the temperature calculated from the thermistor change in resistance, R . The coefficients C0 , C1 , and C2 need to be found using a non-linear regression method. The Steinhart-Hart equation is often simpilfied and rewritten as an exponential of first order:
Now we see an approxate method for relating T to the resistance, R . The coefficients a, b, c can be found using a least-squares fit against factory calibration data that be acquired from the manufacturer. For my thermistor, I found factory tables that allowed me to fit the data using the equation above [example datasheet with table].
Using Python, I was able to download one of the tables for my thermistor and fit the data to an exponential curve using the function above and scipy’s ‘curve_fit’ toolbox. The resulting relationship and coefficients are shown below:
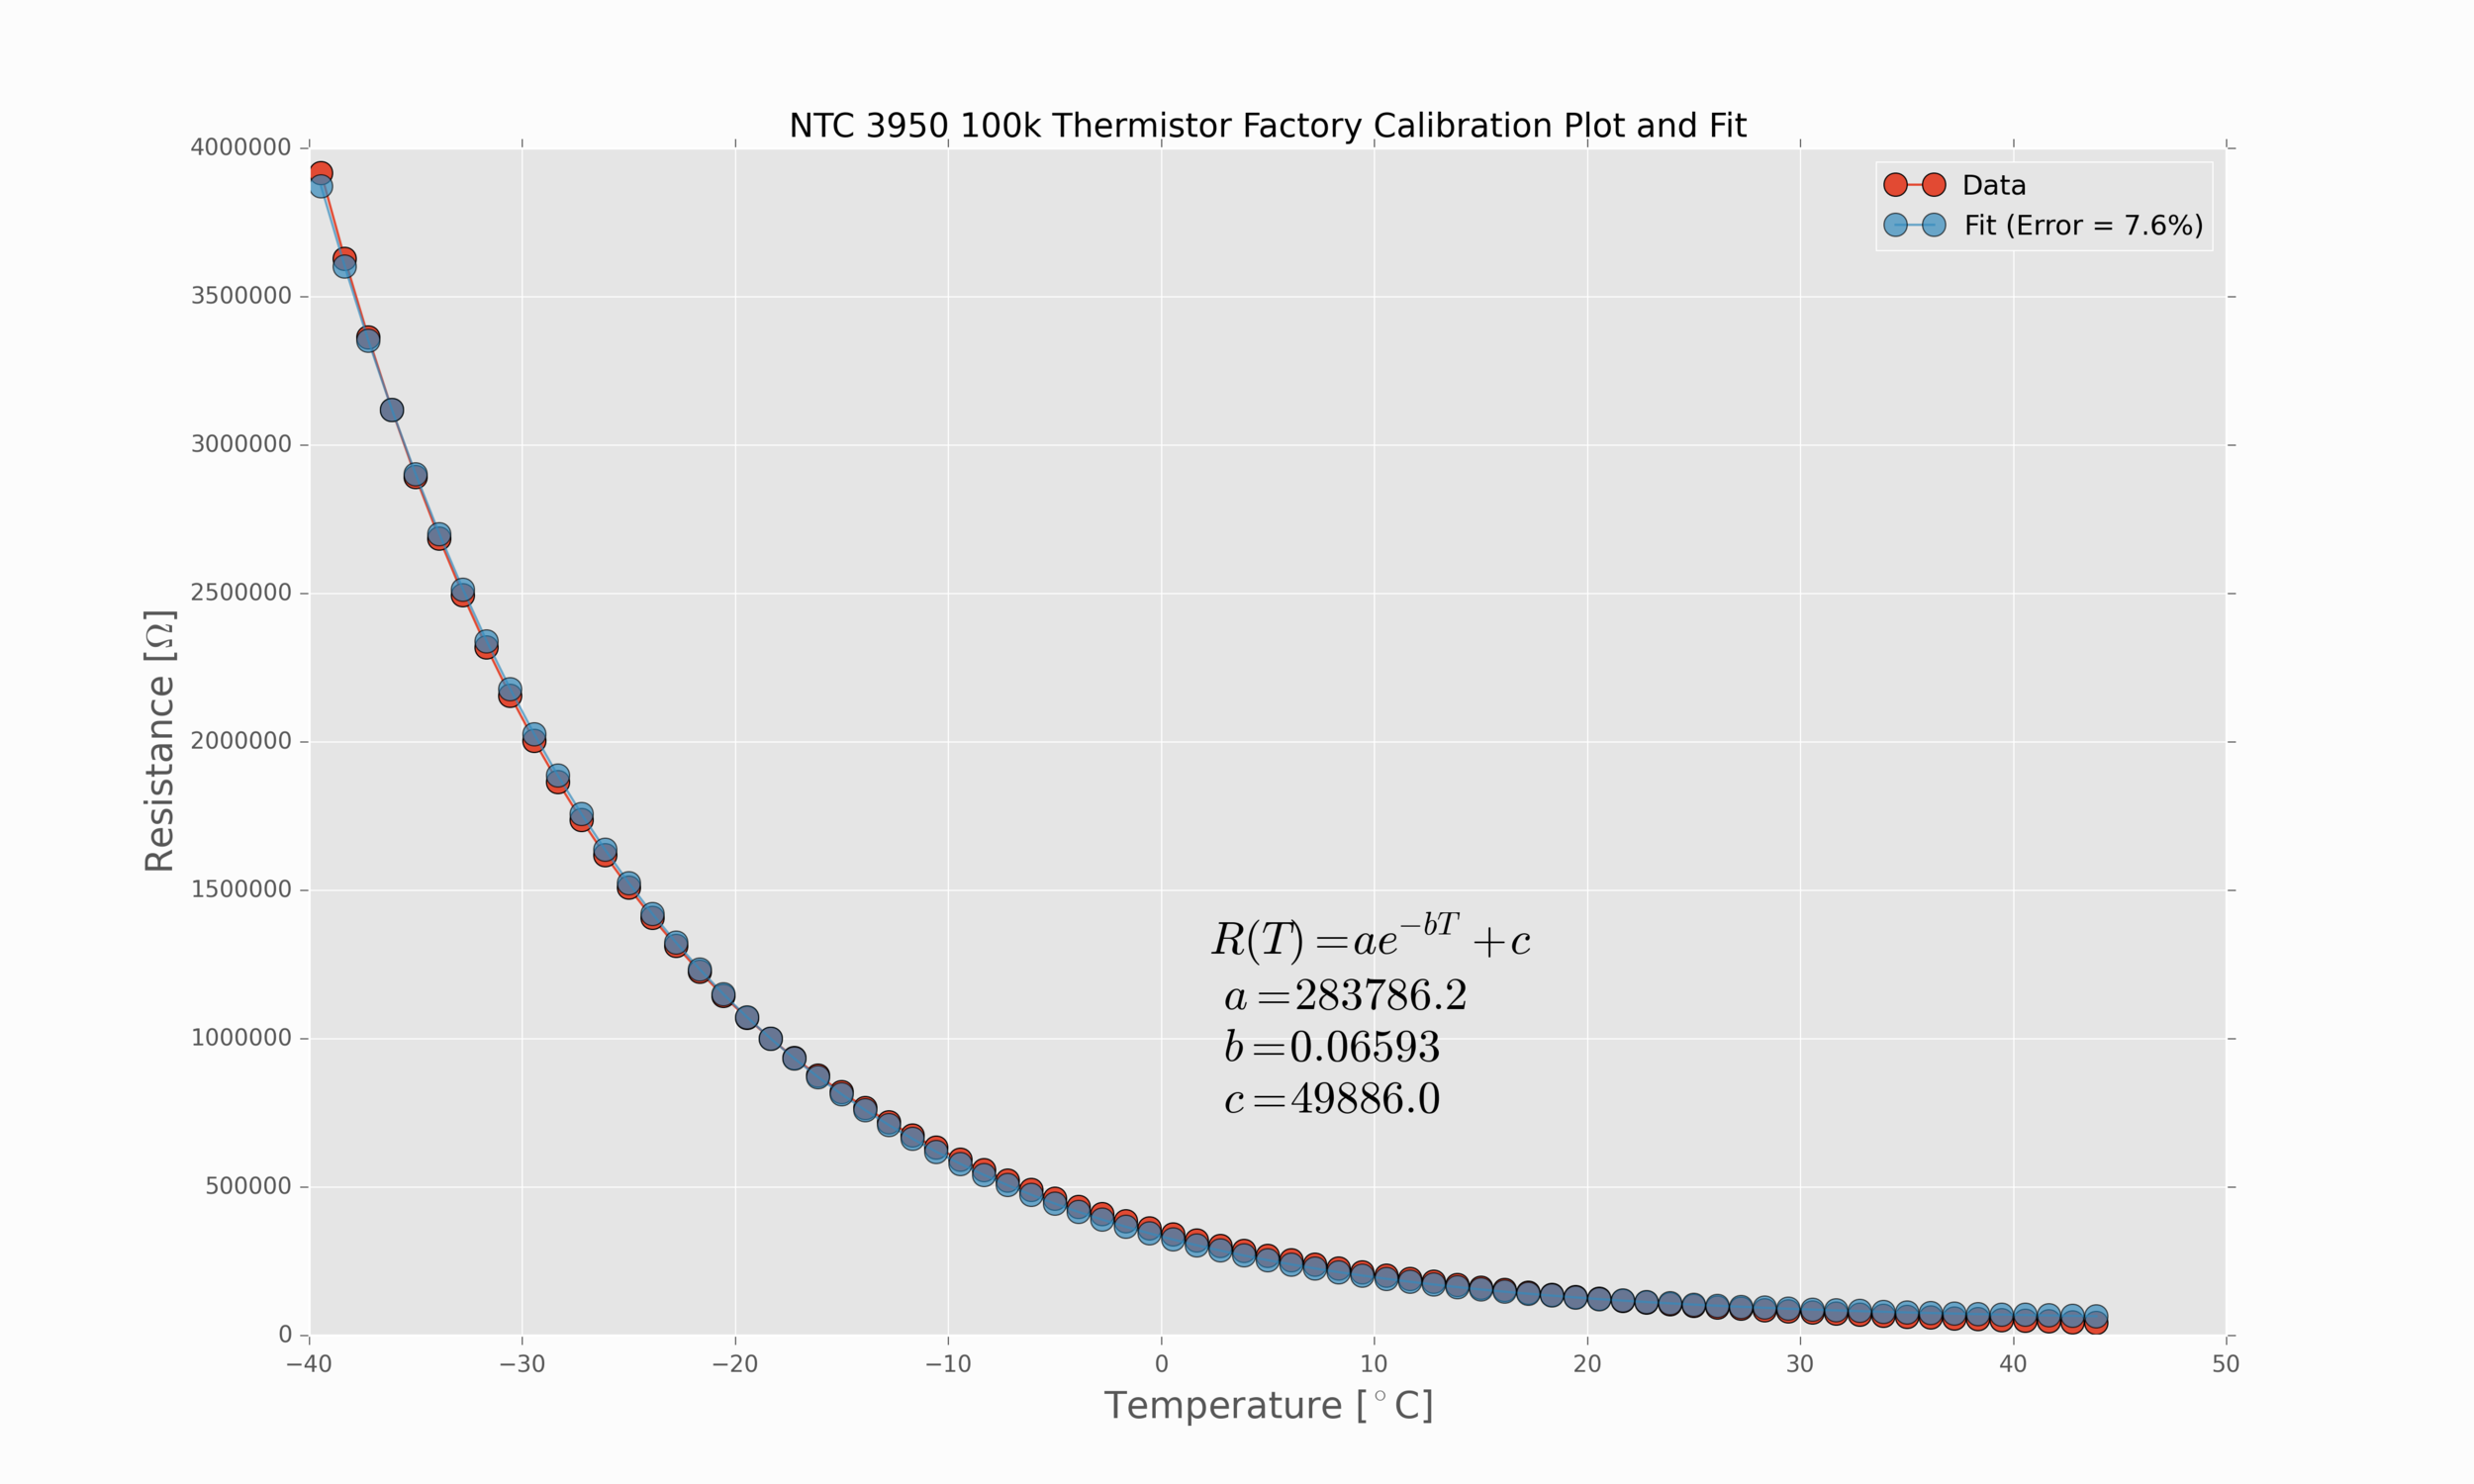
Figure 1: Factory calibration for temperature and resistance relationship for thermistor readings.
Now that we have a relationship between the resistance of the thermistor wire and the temperature measured, we need to understand how we can translate resistance into a meaningful quantity that we can measure using an analog-to-digital converter, namely, we need to convert resistance to voltage. And this is explained in the next section.
Arduino has a 10-bit analog-to-digital converter (ADC) that measures voltage values. Since our thermistor outputs resistance, we need to construct a relationship between our resistance and voltage in order to relate the change in resistance to voltage. We can do this using a simple voltage divider:

Figure 2: Voltage divider circuit for measuring voltage instead of resistance from the thermistor.
For Arduino, we will use 3.3V as our V0 to keep the noise low on the thermistor measurements. Using Kirchhoff’s Laws to derive a relationship between our voltage input and two resistances using the following relation:
which we can rewrite in terms of resistances and the common loop current:
Lastly, we can rewrite our current as a function of the two resistances of the loop:
Combining the last two equations, we can get a representation for the voltage across the second resistor (our thermistor):
And finally, we have the classic voltage divider equation:
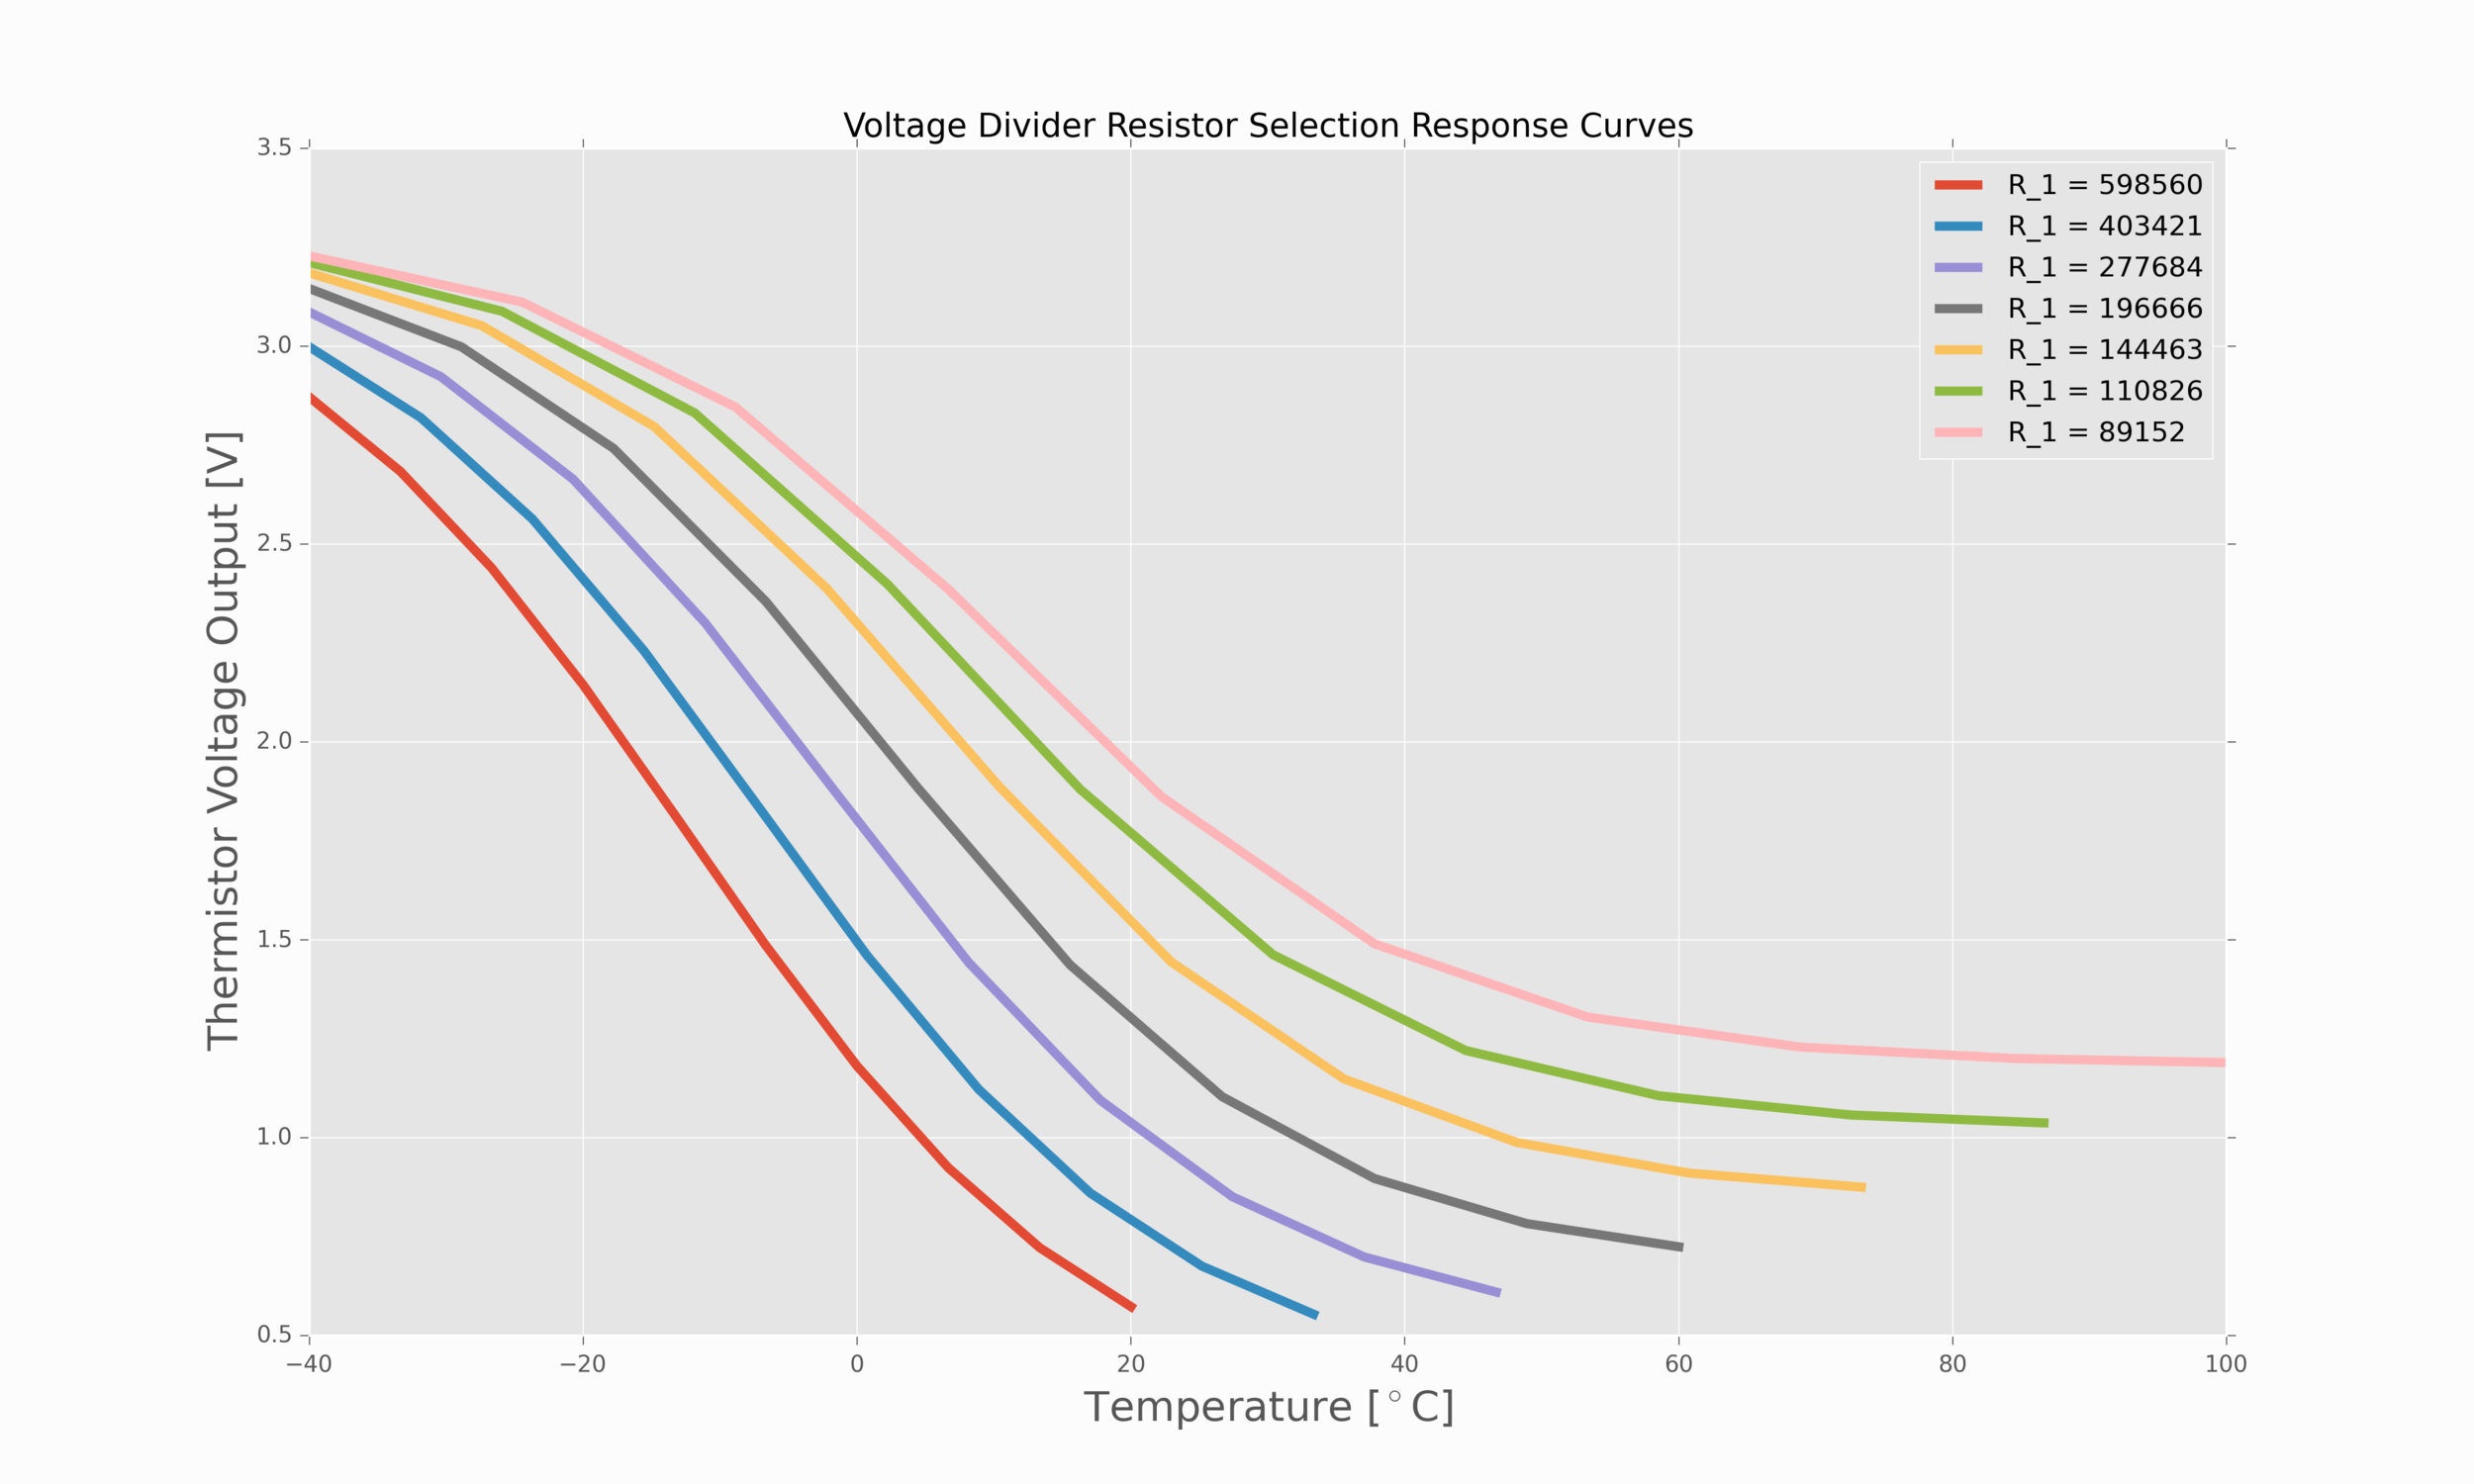
Figure 3: Voltage divider resistance response curves. The response of the thermistor voltage changes based on the voltage divider resistor chosen. Be sure to select a resistor near the resistor above for your specific desired temperature range.
The full implementation of the algorithms and Figures 1 and 3 is implemented below in Python 3.6.
#!/usr/bin/env python3
#
# script for determining resistor pairing with thermistor NTC 3950 100k
#
#
import csv
import numpy as np
import matplotlib.pyplot as plt
from scipy.optimize import curve_fit
from scipy import stats

plt.style.use('ggplot')

def exp_func(x,a,b,c):
    return a*np.exp(-b*x)+c

temp_cal,resist_cal = [],[]
with open('ntc_3950_thermistor_cal_data.csv',newline='') as csvfile:
    csvreader = csv.reader(csvfile)
    for row in csvreader:
        temp_cal.append(float(row[1]))
        resist_cal.append(float(row[2]))

fit_params,_ = curve_fit(exp_func,temp_cal,resist_cal,maxfev=10000)

test_fit = [exp_func(ii,*fit_params) for ii in temp_cal]

RMSE = np.sqrt(np.mean(np.power(np.subtract(test_fit,resist_cal),2)))
mape = np.mean(np.abs(np.divide(np.subtract(resist_cal,test_fit),resist_cal)))*100
err_percent = 100.0*(RMSE/np.mean(np.abs(resist_cal)))
print('RMSE = {0:2.2f} ({1:2.1f}%)'.format(RMSE,err_percent))

fit_txt_eqn = '$R(T) = ae^{-bT}+c$'
fit_txt_params = '\n $a = {0:2.1f}$ \n $b = {1:2.5f}$ \n $c = {2:2.1f}$'.format(*fit_params)
fit_txt = fit_txt_eqn+fit_txt_params

fig1 = plt.figure(figsize=(15,9))
ax = fig1.gca()
plt.plot(temp_cal,resist_cal,marker='o',markersize=10,label='Data')
plt.plot(temp_cal,test_fit,marker='o',markersize=10,alpha=0.7,label='Fit (Error = {0:2.1f}%)'.format(mape))
plt.text(np.mean((temp_cal))
         ,np.mean((resist_cal)),fit_txt,size=20)
plt.title('NTC 3950 100k Thermistor Factory Calibration Plot and Fit')
plt.xlabel(r'Temperature [$^\circ$C]',fontsize=16)
plt.ylabel(r'Resistance [$\Omega$]',fontsize=16)
plt.legend()
#plt.savefig('thermistor_factory_fit.png',dpi=300,facecolor=[252/255,252/255,252/255])
plt.show()

## voltage divider selection for temperature ranges
#
#
fig2 = plt.figure(figsize=(15,9))
ax3 = fig2.add_subplot(1,1,1)

for T_2 in np.linspace(20.0,100.0,7):
    V_0 = 3.3
    T_1 = -40.0
    test_temps = np.linspace(T_1,T_2,10)
    R_2_1 = exp_func((T_1+T_2)/2.0,*fit_params)

    R_1 = R_2_1*((V_0/(V_0/2.0))-1)
    print(R_1)

    ## Thermistor test expectations with various voltage divider resistor values
    #
    #
    R_2 = exp_func(test_temps,*fit_params)
    V_2 = V_0*(1/(np.divide(R_1,R_2)+1))
    ax3.plot(test_temps,V_2,linewidth=4,label='R_1 = {0:2.0f}'.format(R_1))

ax3.set_ylabel('Thermistor Voltage Output [V]',fontsize=18)
ax3.set_xlabel('Temperature [$^\circ$C]',fontsize=18)
plt.legend()
plt.title('Voltage Divider Resistor Selection Response Curves')
#plt.savefig('thermistor_resistor_selection.png',dpi=300,facecolor=[252/255,252/255,252/255])
plt.show()
Now that we have a relationship between the voltage read by the Arduino and the temperature measured by the thermistor, and we have selected our voltage divider resistor - we can now test if the system works and if our algorithm is correct! The correct prediction of temperature from the known parameters above is as follows:
Figure 4: Arduino + Thermistor voltage divider circuit. Also take note of the external reference at 3.3V - we choose 3.3V because the voltage divider circuit will likely never reach the higher voltages due to the operating range we are interested in. The 3.3V choice also results in lower noise for the ADC. I have also attached a 10uF capacitor across the 3.3V and GND pins to lower some of the noise as well.
A few observations can be made regarding the wiring diagram above. The first, is that a 10uF capacitor is placed between the 3.3V and GND pins. Also, it is important to note that we will be using an external voltage reference using the 3.3V pin. And the reason is twofold: the expected voltage from the thermistor will be in the 1.5V range, and secondly, the 3.3V pin has less noise so our voltage readings will be more stable, resulting in more stable temperature readings (read more about the reference voltage here). The Arduino code for measuring temperature using our derivations above and the wiring in Figure 4 is below:
// Arduino code for use with NTC thermistor

#include <math.h>

#define therm_pin A0
float T_approx;

float V_0 = 3.3; // voltage reference

// first resistance value for voltage divider
float R_1 = 220000.0;
// fit coefficients
float a = 283786.2;
float b = 0.06593;
float c = 49886.0;

int avg_size = 10; // averaging size

void setup() {
  // initialize serial communication at 9600 bits per second:
  Serial.begin(9600);
  pinMode(therm_pin,INPUT);

  // set analog reference to read AREF pin
  analogReference(EXTERNAL);
}

void loop() {

  // loop over several values to lower noise
  float T_sum = 0.0;
  for (int ii;ii<avg_size;ii++){
    // read the input on analog pin 0:
    int sensorValue = analogRead(therm_pin);
    // Convert the analog reading (which goes from 0 - 1023) to voltage reference (3.3V or 5V or other):
    float voltage = (sensorValue/1023.0)*V_0;

    // this is where the thermistor conversion happens based on parameters from fit
    T_sum+=(-1.0/b)*(log(((R_1*voltage)/(a*(V_0-voltage)))-(c/a)));
  }

  // averaging values from loop
  T_approx = T_sum/float(avg_size);

  // readout for Celsius and Fahrenheit
  Serial.print("Temperature: ");
  Serial.print(T_approx);
  Serial.print(" (");
  Serial.print((T_approx*(9.0/5.0))+32.0);
  Serial.println(" F)");

  delay(500);
}
The code above averages 10 temperature readings for a more stable output and gives a readout roughly every 500 ms in both Celsius and Fahrenheit. The parameters should be updated for the user-specific thermistor, and the average amount can also be adjusted based on the user’s desired stability.
Capacitor results in smoothed temperature response

Figure 5: Capacitor smoothing effect on ADC for thermistor reading.
In the next section I compare our thermistor to a DHT22 temperature and humidity sensor.
As a simple test, I decided to wire up a DHT22 temperature and humidity sensor to see how well the thermistor equation approximate temperature based on its resistance. The DHT22 is a classic Arduino sensor, so I expected the two to be fairly close when compared at room temperature. I also wanted to see their respective responses when their surrounding temperatures are increased and watch the response with time to get an idea of how the sensors work over actively changing temperature scenarios.
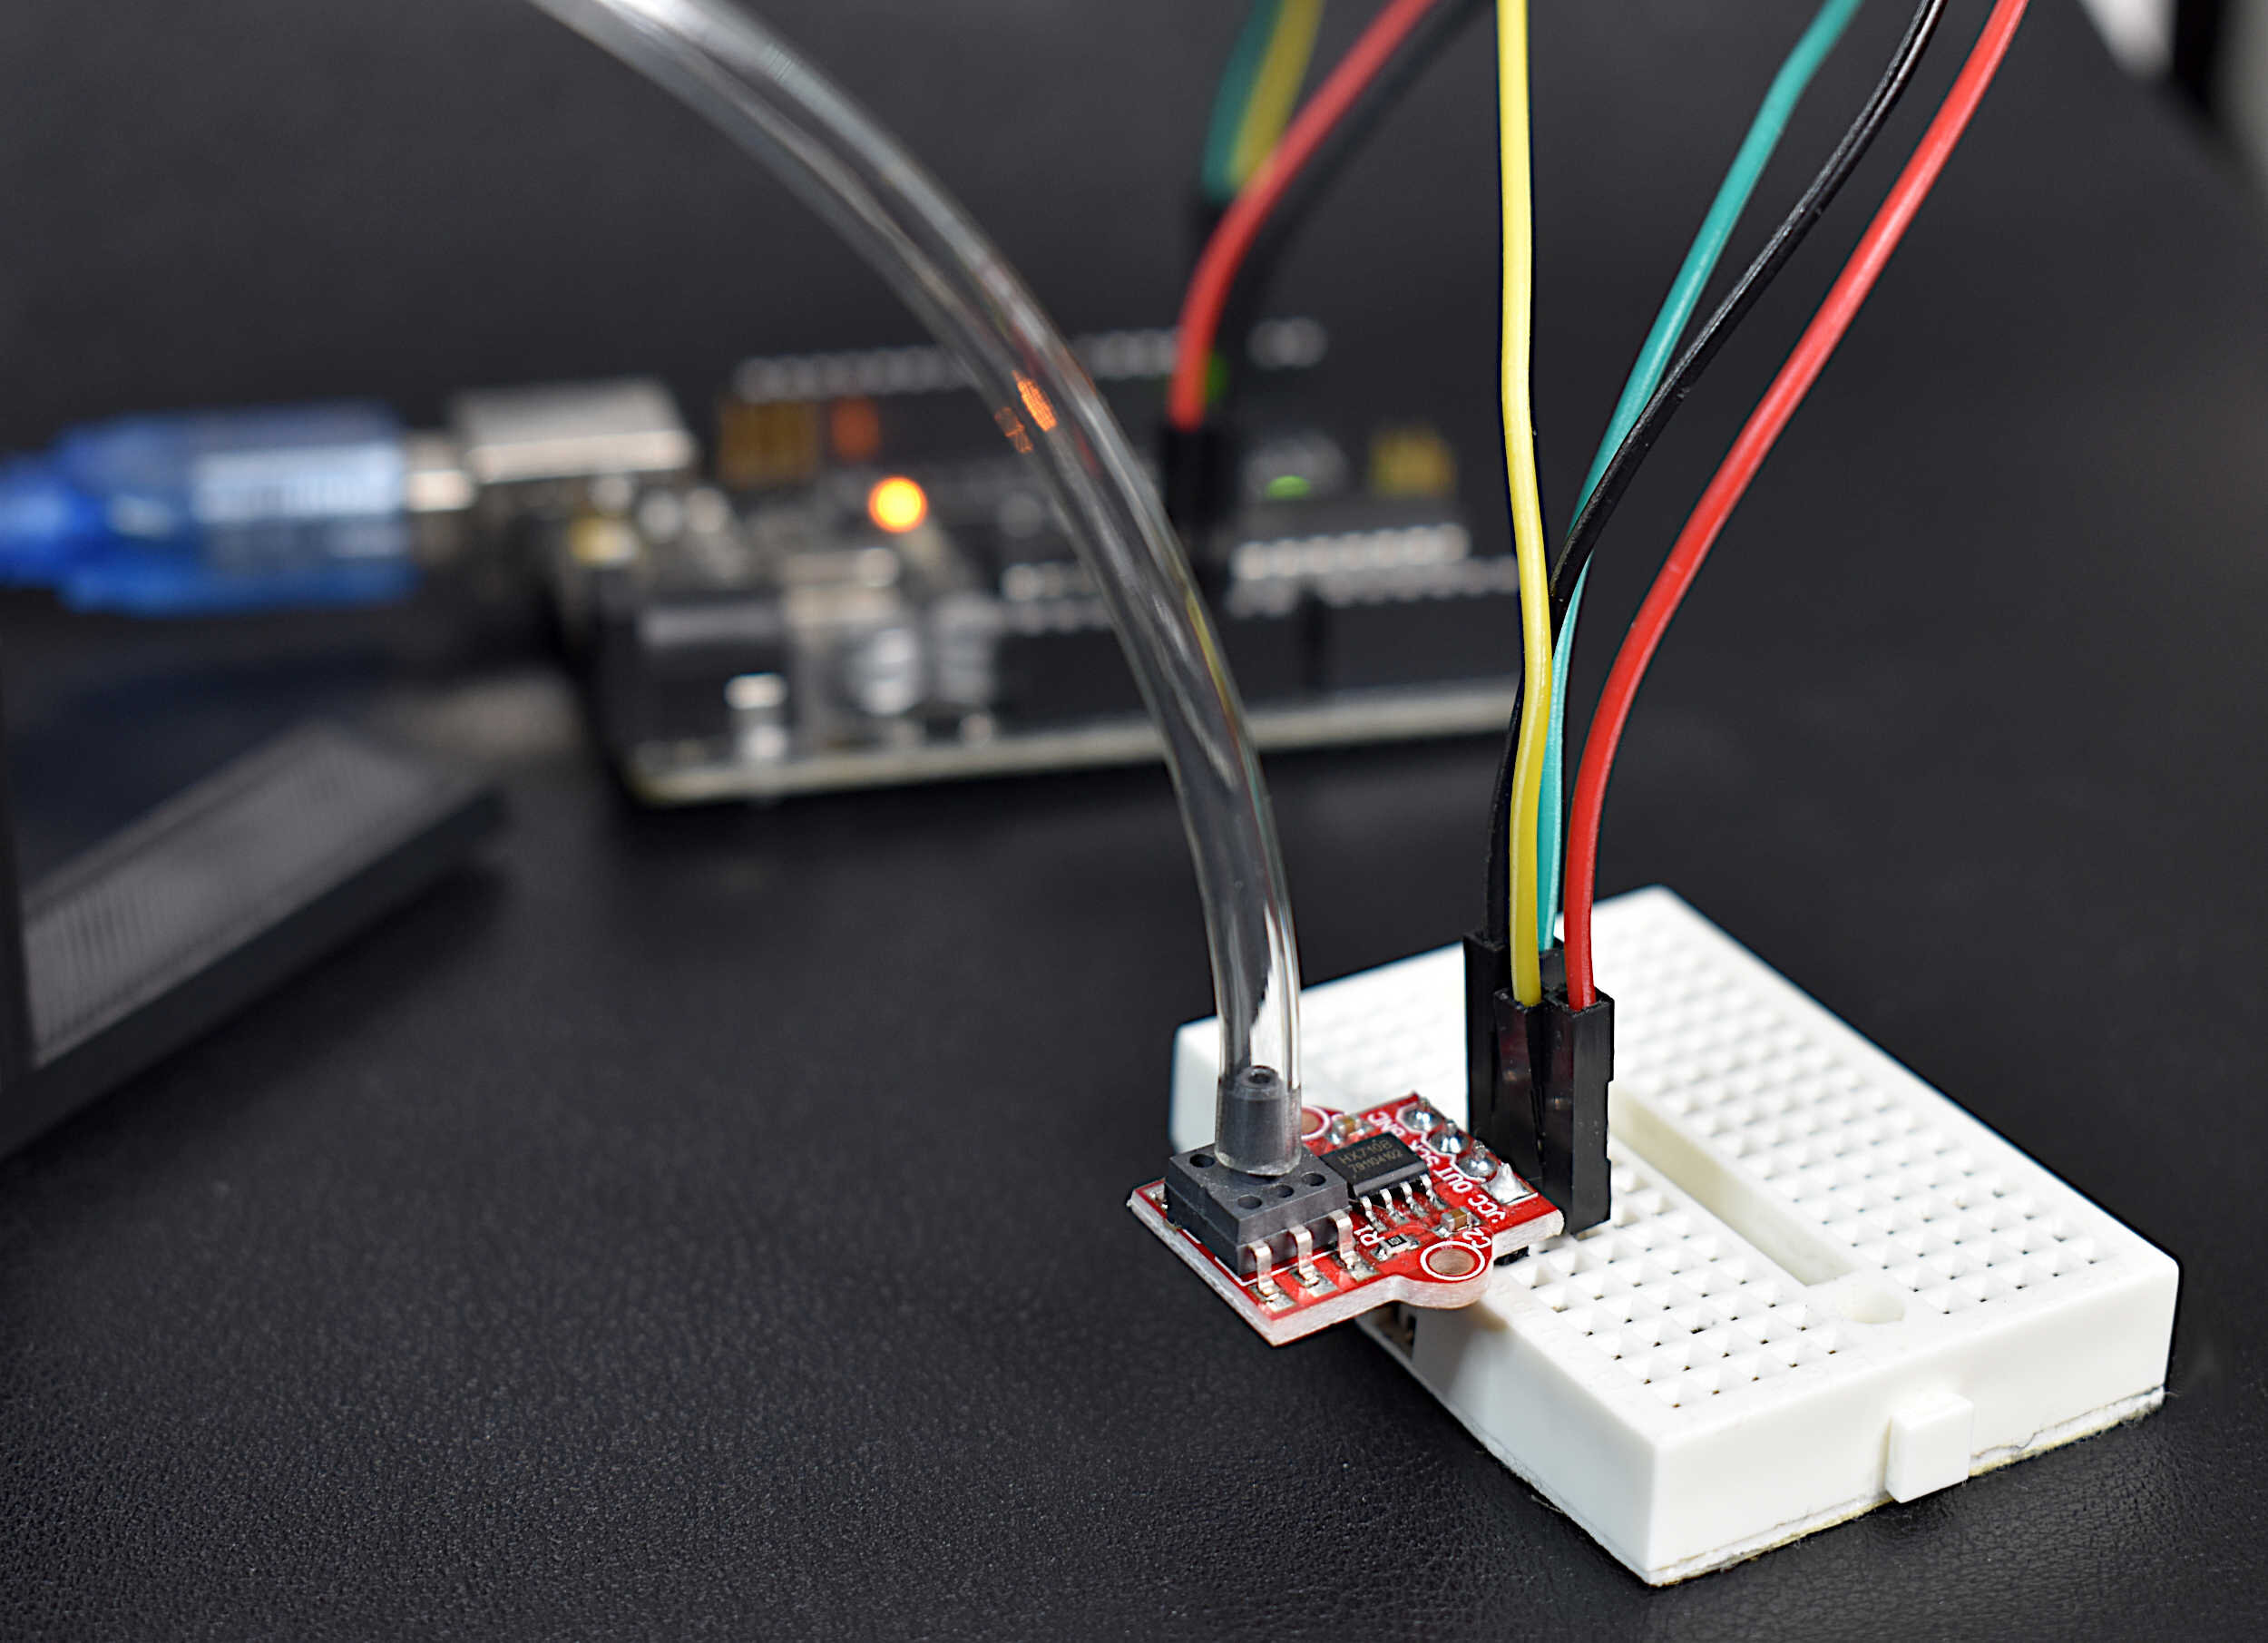
The wiring for the thermistor and DHT22 sensor combination is shown below.

Figure 6: Wiring for comparison between DHT22 sensor and thermistor.
The Arduino code to accompany the DHT22 and thermistor comparison is also given below. It uses the “SimpleDHT” library which can be installed through the Library Manager.
#include <math.h>
#include <SimpleDHT.h>

#define therm_pin A0
#define pinDHT22 2

float T_approx;

float V_0 = 3.3;
float R_1 = 220000.0;
float a = 283786.2;
float b = 0.06593;
float c = 49886.0;

int avg_size = 50;

SimpleDHT22 dht22;

void setup() {
  // initialize serial communication at 9600 bits per second:
  Serial.begin(9600);
  pinMode(therm_pin,INPUT);
  analogReference(EXTERNAL);
}

// the loop routine runs over and over again forever:
void loop() {
  float T_sum = 0.0;
  for (int ii;ii<avg_size;ii++){
    // read the input on analog pin 0:
    int sensorValue = analogRead(therm_pin);
    // Convert the analog reading (which goes from 0 - 1023) to voltage reference (3.3V or 5V or other):
    float voltage = (sensorValue/1023.0)*V_0;

    T_sum+=(-1.0/b)*(log(((R_1*voltage)/(a*(V_0-voltage)))-(c/a)));
  }

  T_approx = T_sum/float(avg_size);

  Serial.print("Thermistor: ");
  Serial.print(T_approx);
  Serial.print(" (");
  Serial.print((T_approx*(9.0/5.0))+32.0);
  Serial.println(" F)");

  float temperature = 0;
  dht22.read2(pinDHT22, &temperature, NULL, NULL);
  Serial.print("DHT22: ");
  Serial.print((float)temperature); Serial.println(" *C, ");

  Serial.print("Difference: ");
  Serial.print(temperature-T_approx);
  Serial.println(" C");
  delay(500);
}
The code above calculates both temperatures and prints them to the serial monitor every 0.5 seconds. It also averages every 10 readings from the thermistor. The code also prints out the difference between the two temperature sensor methods. Below, I have plotted the temperature difference to show the average deviation between thermistor and DHT22.

Difference Between DHT22 and NTC Thermistor Temperature Readings
On average and depending on the actual temperature, the difference can span 0.05 C - 1.5 C. And this span is likely due to a few things: the ADC is somewhat noisy on the Arduino, even with a capacitor and 3.3V external voltage reference - not to mention it’s only 10-bit; the thermistor equation also carries some error with it - so for highly accurate readings a temperature-by-temperature interpolation would be the most accurate way to ensure quality results; and lastly, the DHT22 additionally carries 0.5 C error with it, so we can expect errors between them to be as high as 2 C. So, the fact that we’re only seeing 0.5 C difference between them is not bad!
Just to contrast the abilities of the two sensors, the plot below demonstrates the power of the thermistor and the weakness of the DHT22:

Difference Between DHT22 and Thermistor During a Hot Gust
In the plot above, it’s easy to see the power of the thermistor and its ability to handle quick-changing scenarios. The DHT22 is only equipped to handle a 0.5s update rate, and in reality can only resolve ambient temperatures, not large bursts of hot or cold. The plot below really illustrates the deficiencies in the DHT22’s ability to handle bursts of temperature changes. Thermistors have temperature responses that are fairly quick, while the DHT22 takes a few readings. The DHT22 also requires some time to recover from a heating period, primarily because of its housing and slow component response.

Thermistor and DHT22 Thermal Responses
The thermistor is a clear winner when temperature fluctuations are of great importance to measurements. This is why they are often used in experiments where temperatures do fluctuate quickly and accurate measurements are needed.

Figure 7: Glass beaded thermistor next to a DHT22 temperature sensor.
In this article, I discussed thermistors and how to implement them in Arduino by fitting factory calibrated data to acquire accurate coefficients for finding temperature from resistance. I also discussed how to use a voltage divider to measure voltage as a function of resistance outputted form the thermistor. And lastly, I used a DHT22 temperature sensor to compare the accuracy and advantages of using a thermistor.
Thermistors are used in a wide variety of applications because of their accuracy, high responsivity in rapidly changing environments, and their inexpensive and easy-to-use hardware. One of the difficulties with using thermistors is their non-linear repsonse, however with quality calibration and response curves, the non-linear effects can be handled. There are many other experiments that can be done with thermistors to analyze their time responses, lower the non-linear hindrances, and investigate the self-heating effects. This project was meant to introduce thermistors and their theory, while also increasing the understanding of why they are a great choice over other temperature-sensing methods.
Thanks to PCBGOGO for PCB prototyping help and for sponsoring me in this project.
If you enjoyed the experiment, please share the project and go to pcbgogo.com to purchase a custom PCB board for your own electronics projects.
See More in Arduino and Sensors: