Radar Emulator with Arduino + Python
“As an Amazon Associates Program member, clicking on links may result in Maker Portal receiving a small commission that helps support future projects.”
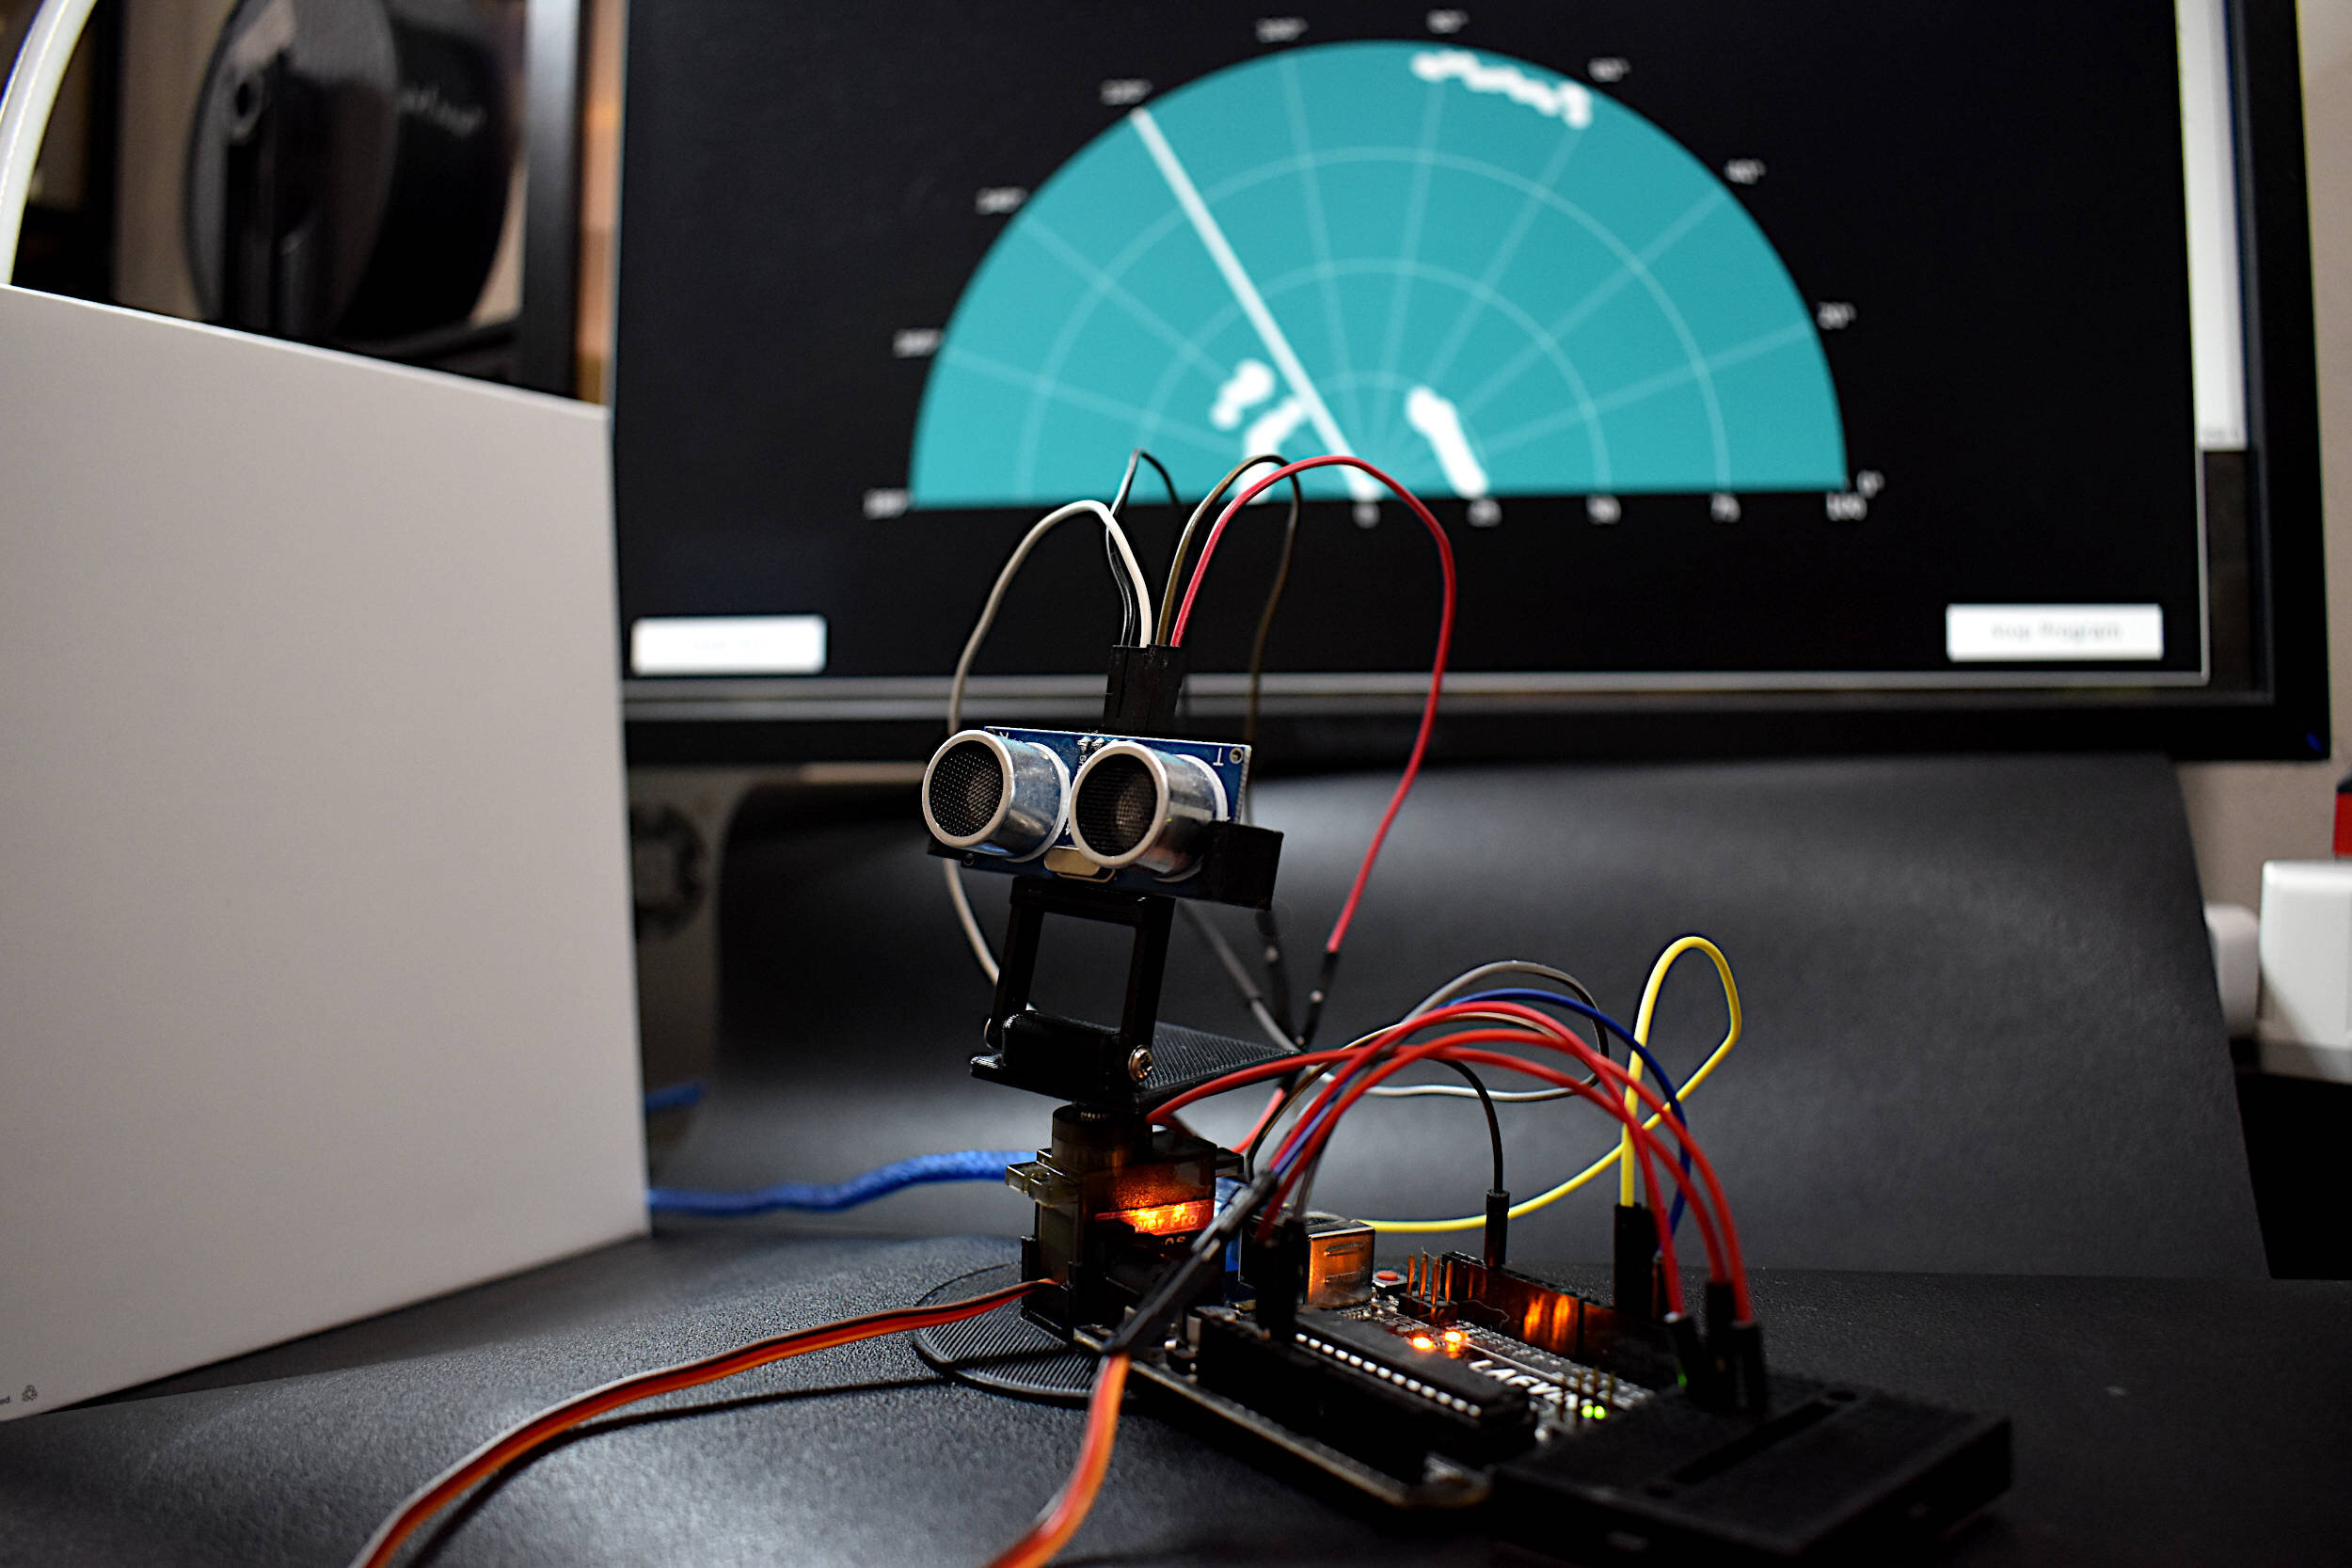
The word radar is a combination of ‘RAdio Detection And Ranging’ - which describes the function of early radar systems that were developed to detect and range approaching enemy aircraft using radio waves. Commonly, radar systems use a visualization tool called a plan position indicator (PPI), which places points in a polar configuration to represent objects occupying space in the range of the detector (read more about radar: Introduction to Radar Systems). In this tutorial, an ultrasonic sensor (HC-SR04) will be used in place of a radio emitter; and a plan position indicator will be constructed in Python by recording the angular movements of a servo motor. An Arduino board will both record the ranging data from the ultrasonic sensor while also controlling and outputting the angular position of the servo motor. This will permit the creation of a PPI for visualizing the position of various objects surrounding the radar system.
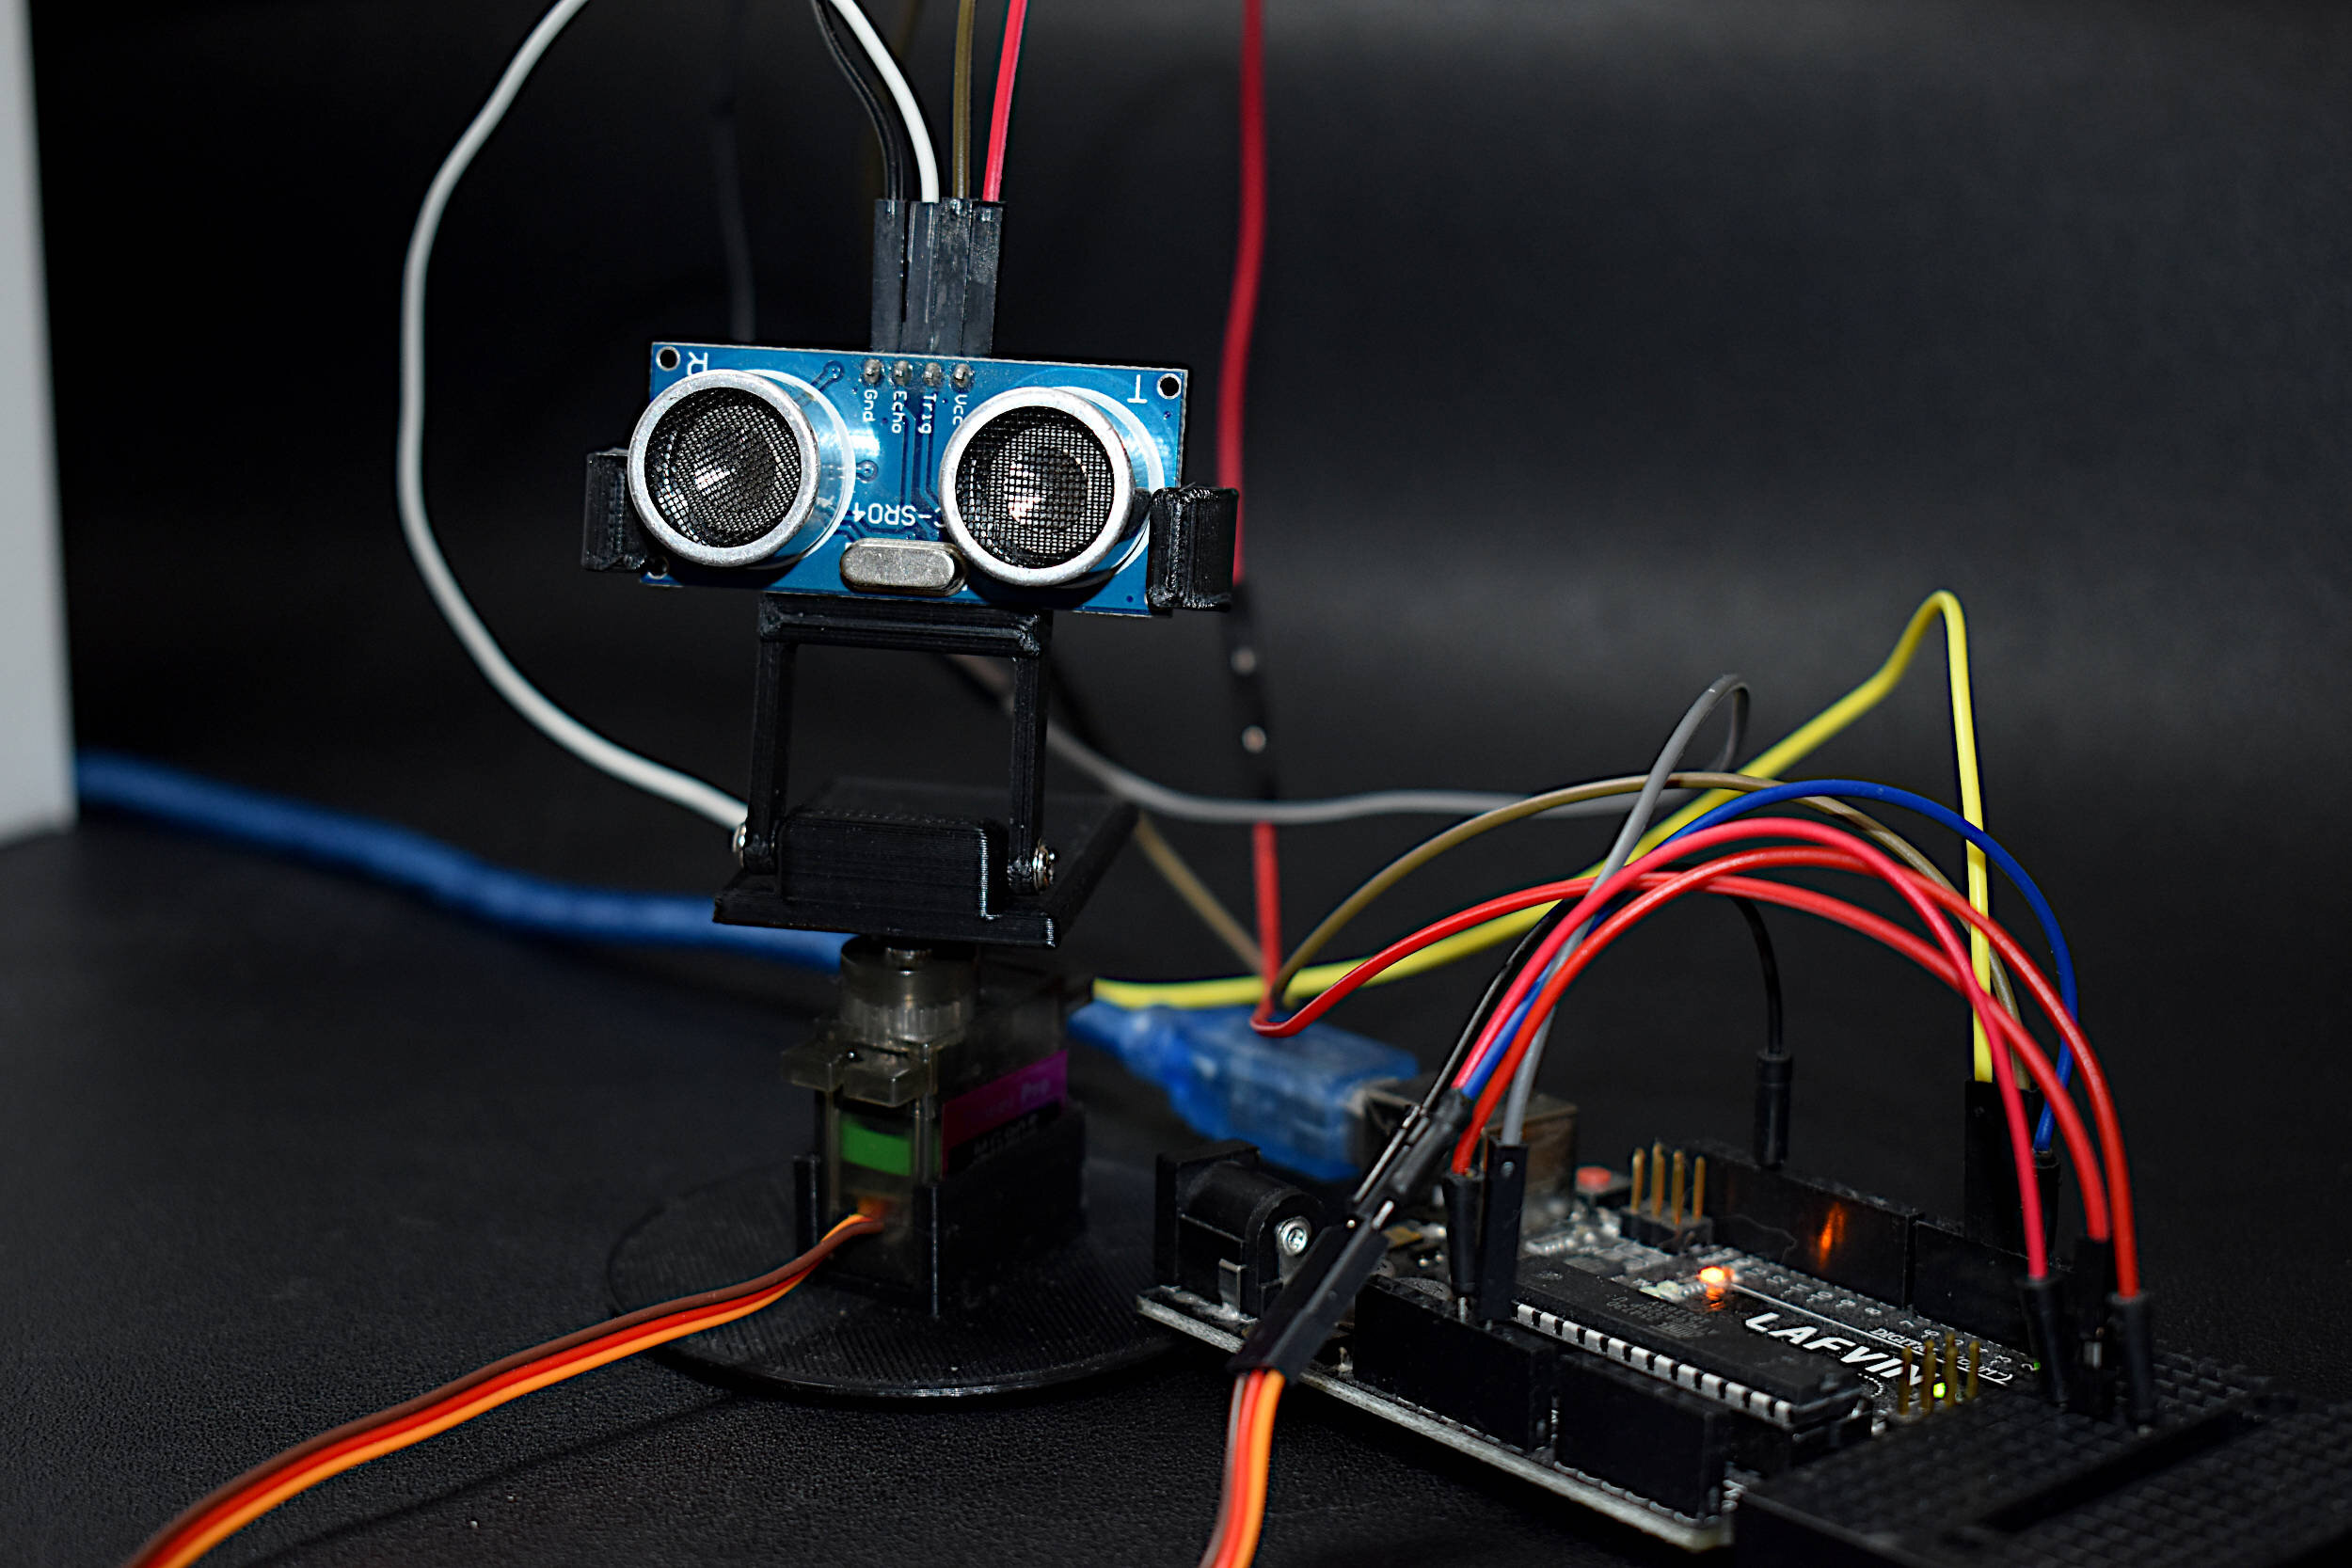
The replication of a radar system involves two essential components: a ranging device and an angular motor/detector. As stated above, the ranging device can be any device that detects distance from a stationary point. The HC-SR04 ultrasonic device will be used, however the VL53L0X ranging sensor (uses the time-of-flight technique with a 940nm laser) has also been used and works just fine with this tutorial as well. A kit has been assembled specifically for replicating this tutorial, and it is recommended for following along with this tutorial. The only thing needed in addition to the kit is an Arduino board and a computer. The individual components are listed below as well, in case the user wants to assemble the components independently:
Tutorial Kit:
Arduino Radar Kit with HC-SR04 and MG90S - $ 15.00 [Our Store]
Entire Component List:
Arduino Uno Board - $13.00 [Our Store]
MG90S Micro Servo Motor - $7.00 [Our Store]
HC-SR04 Ultrasonic Sensor - $6.00 [Our Store]
Jumper Wires - $1.80 (12 pcs: 8 male-to-female, 4 male-to-male) [Our Store]
Mini Breadboard - $3.00 [Our Store]
VL53L0X Time-of-Flight Sensor - $10.00 [Our Store]
Raspberry Pi 4 Computer - $55.00 [2GB from Our Store]
The HC-SR04 and MG90S can be wired to an Arduino Uno board using the following diagram:


The Arduino code uses this particular wiring configuration, however, the pins can easily be changed in the code to represent specific wirings. The Python code given later will also describe how the Arduino is being read through the serial port, and why certain Serial.print() methods are called.
The Arduino code uses the servo library to communicate via pulse-width modulation (PWM) over one of its pins [read more about PWM with the Raspberry Pi Panning Camera Tutorial or the Arduino Servo Basics Tutorial]. A custom algorithm is used to retrieve ranging data from the HC-SR04, using the time-of-flight effect for sound waves. Both the angle of the MG90S servo motor (0° - 180°) and the distance approximated from the HC-SR04 (2cm - 400cm) are outputted to the serial port for a Python program to read (more on this later). The Arduino code is thus given below:
#include <Servo.h>

Servo servo_1; // servo controller (multiple can exist)

int trig = 4; // trig pin for HC-SR04
int echo = 5; // echo pin for HC-SR04
int servo_pin = 3; // PWM pin for servo control

int pos = 0;    // servo starting position
float duration,distance;

void setup() {
  Serial.begin(115200);
  Serial.println("Radar Start");
  servo_1.attach(servo_pin); // start servo control
  pinMode(trig,OUTPUT);
  pinMode(echo,INPUT);
}

void loop() {
  for (pos = 0; pos <= 180; pos += 1) { // goes from 0 degrees to 180 degrees
    // in steps of 1 degree
    servo_1.write(pos);              // tell servo to go to position in variable 'pos'
    delay(60); // delay to allow the servo to reach the desired position
    dist_calc(pos);
  }

  for (pos = 180; pos >= 0; pos -= 1) { // goes from 180 degrees to 0 degrees
    servo_1.write(pos);              // tell servo to go to position in variable 'pos'
    delay(60);
    dist_calc(pos);
  }
}

float dist_calc(int pos){
  // trigger 40kHz pulse for ranging
  digitalWrite(trig,LOW);
  delayMicroseconds(2);
  digitalWrite(trig,HIGH);
  delayMicroseconds(10);
  digitalWrite(trig,LOW);
  // convert from duration for pulse to reach detector (microseconds) to range (in cm)
  duration = pulseIn(echo,HIGH); // duration for pulse to reach detector (in microseconds)
  distance = 100.0*(343.0*(duration/2.0))/1000000.0; // 100.0*(speed of sound*duration/2)/microsec conversion

  Serial.print(pos); // position of servo motor
  Serial.print(","); // comma separate variables
  Serial.println(distance); // print distance in cm
}
The time-of-flight equation, given in the ‘dist_calc()’ function, uses the following principle:

where d is the distance from the HC-SR04 sensor to the object it is detecting, c is the speed of sound in air (~343m/s), and Δt is the recorded time it takes for the pulse to reach the target and arrive back at the receiver (detector).
Opening the serial port on the Arduino should read the following:

note: Verifying the printout above is essential for continuing with this tutorial
If the printout is not similar to that above, then the Python serial reader code in the following section will not work properly. The ‘Radar Start’ printout tells the Python code to start its radar analysis, and the comma-separated 'angle,distance' format feeds the data exactly as it needs to be read in the Python code. Therefore, if the printout does not mimic that above, then the Python code will return errors.
In Python, this project become exponentially more complex. The reason being, as stated in the introduction to this tutorial, a plan position indicator (PPI) will be used to visualize the point map as the MG90S motor rotates 180° back and forth about its axis. The reason why this becomes difficult, is that we now need to take a polar plot and populate it with the outputs of the Arduino board. Therefore, our process becomes the following:
Start communication with Arduino board
Create polar plot for radar emulator
Begin looping through incoming Arduino data
Wait for ‘Radar Start’ to begin plotting
Update scatter points and PPI
And if this were to be done exactly as it is referenced above, it would take quite a bit of resources to do in real-time. Thus, a few work arounds are implemented to ensure efficiency in the plotting and reading of data. The following are simplifications and implementations of efficient methods for update and plotter the angle and ranging scatter points received by the Arduino:
Only update the data, not the plot (restore_region(), drawartist(), and blit() snippets of code below)
Only plot every 5 degrees of rotation
All of the routine and implementations above are given below in the code, with comments where necessary:
# Python + Arduino-based Radar Plotter
#
# ** Works with any motor that outputs angular rotation
# ** and with any distance sensor (HC-SR04, VL53L0x,LIDAR)
#
import numpy as np
import matplotlib
matplotlib.use('TkAgg')
import matplotlib.pyplot as plt
from matplotlib.widgets import Button
import serial,sys,glob
import serial.tools.list_ports as COMs
#
#
############################################
# Find Arudino ports, select one, then start communication with it
############################################
#
def port_search():
    if sys.platform.startswith('win'): # Windows
        ports = ['COM{0:1.0f}'.format(ii) for ii in range(1,256)]
    elif sys.platform.startswith('linux') or sys.platform.startswith('cygwin'):
        ports = glob.glob('/dev/tty[A-Za-z]*')
    elif sys.platform.startswith('darwin'): # MAC
        ports = glob.glob('/dev/tty.*')
    else:
        raise EnvironmentError('Machine Not pyserial Compatible')

    arduinos = []
    for port in ports: # loop through to determine if accessible
        if len(port.split('Bluetooth'))>1:
            continue
        try:
            ser = serial.Serial(port)
            ser.close()
            arduinos.append(port) # if we can open it, consider it an arduino
        except (OSError, serial.SerialException):
            pass
    return arduinos

arduino_ports = port_search()
ser = serial.Serial(arduino_ports[0],baudrate=115200) # match baud on Arduino
ser.flush() # clear the port
#
############################################
# Start the interactive plotting tool and
# plot 180 degrees with dummy data to start
############################################
#
fig = plt.figure(facecolor='k')
win = fig.canvas.manager.window # figure window
screen_res = win.wm_maxsize() # used for window formatting later
dpi = 150.0 # figure resolution
fig.set_dpi(dpi) # set figure resolution

# polar plot attributes and initial conditions
ax = fig.add_subplot(111,polar=True,facecolor='#006d70')
ax.set_position([-0.05,-0.05,1.1,1.05])
r_max = 100.0 # can change this based on range of sensor
ax.set_ylim([0.0,r_max]) # range of distances to show
ax.set_xlim([0.0,np.pi]) # limited by the servo span (0-180 deg)
ax.tick_params(axis='both',colors='w')
ax.grid(color='w',alpha=0.5) # grid color
ax.set_rticks(np.linspace(0.0,r_max,5)) # show 5 different distances
ax.set_thetagrids(np.linspace(0.0,180.0,10)) # show 10 angles
angles = np.arange(0,181,1) # 0 - 180 degrees
theta = angles*(np.pi/180.0) # to radians
dists = np.ones((len(angles),)) # dummy distances until real data comes in
pols, = ax.plot([],linestyle='',marker='o',markerfacecolor = 'w',
                 markeredgecolor='#EFEFEF',markeredgewidth=1.0,
                 markersize=10.0,alpha=0.9) # dots for radar points
line1, = ax.plot([],color='w',
                  linewidth=4.0) # sweeping arm plot

# figure presentation adjustments
fig.set_size_inches(0.96*(screen_res[0]/dpi),0.96*(screen_res[1]/dpi))
plot_res = fig.get_window_extent().bounds # window extent for centering
win.wm_geometry('+{0:1.0f}+{1:1.0f}'.\
                format((screen_res[0]/2.0)-(plot_res[2]/2.0),
                       (screen_res[1]/2.0)-(plot_res[3]/2.0))) # centering plot
fig.canvas.toolbar.pack_forget() # remove toolbar for clean presentation
fig.canvas.set_window_title('Arduino Radar')

fig.canvas.draw() # draw before loop
axbackground = fig.canvas.copy_from_bbox(ax.bbox) # background to keep during loop

############################################
# button event to stop program
############################################

def stop_event(event):
    global stop_bool
    stop_bool = 1
prog_stop_ax = fig.add_axes([0.85,0.025,0.125,0.05])
pstop = Button(prog_stop_ax,'Stop Program',color='#FCFCFC',hovercolor='w')
pstop.on_clicked(stop_event)
# button to close window
def close_event(event):
    global stop_bool,close_bool
    if stop_bool:
        plt.close('all')
    stop_bool = 1
    close_bool = 1
close_ax = fig.add_axes([0.025,0.025,0.125,0.05])
close_but = Button(close_ax,'Close Plot',color='#FCFCFC',hovercolor='w')
close_but.on_clicked(close_event)

fig.show()

############################################
# inifinite loop, constantly updating the
# 180deg radar with incoming Arduino data
############################################
#
start_word,stop_bool,close_bool = False,False,False
while True:
    try:
        if stop_bool: # stops program
            fig.canvas.toolbar.pack_configure() # show toolbar
            if close_bool: # closes radar window
                plt.close('all')
            break
        ser_bytes = ser.readline() # read Arduino serial data
        decoded_bytes = ser_bytes.decode('utf-8') # decode data to utf-8
        data = (decoded_bytes.replace('\r','')).replace('\n','')
        if start_word:
            vals = [float(ii) for ii in data.split(',')]
            if len(vals)<2:
                continue
            angle,dist = vals # separate into angle and distance
            if dist>r_max:
                dist = 0.0 # measuring more than r_max, it's likely inaccurate
            dists[int(angle)] = dist
            if angle % 5 ==0: # update every 5 degrees
                pols.set_data(theta,dists)
                fig.canvas.restore_region(axbackground)
                ax.draw_artist(pols)

                line1.set_data(np.repeat((angle*(np.pi/180.0)),2),
                   np.linspace(0.0,r_max,2))
                ax.draw_artist(line1)

                fig.canvas.blit(ax.bbox) # replot only data
                fig.canvas.flush_events() # flush for next plot
        else:
            if data=='Radar Start': # stard word on Arduno
                start_word = True # wait for Arduino to output start word
                print('Radar Starting...')
            else:
                continue

    except KeyboardInterrupt:
        plt.close('all')
        print('Keyboard Interrupt')
        break
The code has been tested for Linux (Raspberry Pi), Windows 10, and Mac's Catalina OS - all with Python 3.6+
After running the code above, the following plot should appear:

The graphical user interface (GUI) allows users to stop the program or close the plot and exit the program. Meanwhile, the plot should be updated every 5 degrees (about every 300ms), with scatter points being placed where objects are detected by the HC-SR04. There is also a sweeping arm that is part of the plan position indicator, which notifies the user of the approximate location of the motor or area being ranged.
A full video demonstration of the Arduino sweeping radar using the MG90S servo and HC-SR04 sensor is given below, where the Python code is implemented on a Raspberry Pi via its USB port:
One final thing to note is that the HC-SR04 does not produce perfect points in space. Its cone of detection is roughly 15° - meaning that it can accurately predict distances at short range, but at longer ranges it has difficulty discerning small area objects from larger area objects. The 15° cone of direction amounts to roughly an object area of 13% of the distance it might be. As an example, an object that is 1m away will need to be 130cm for the HC-SR04 to properly detect it. If the area is smaller, then it may misinterpret the size of the object and therefore its ability to recognize it. If the object is larger than 130cm, then it may register over multiple angles until it is out of the majority sight of the sensor. If we assume a person is about 50cm wide, this means that at about 400cm the HC-SR04 will properly recognize it. If the person is further than 400cm, then the sensor may not register the person, whereas if the person is within 400cm, then it will recognize it over multiple angles.

An Arduino-based radar project was implemented in this tutorial using an Arduino, HC-SR04 ultrasonic distance sensor, MG90S micro servo motor, and Python code run on a Raspberry Pi. The goal of this project was to introduce a novel concept related to real-world technology, but implemented through inexpensive tools available to the maker and aspiring engineer. The HC-SR04 uses sound waves to approximate the distance between its receiver and an object in the distance, while the MG90S servo rotates in a prescribed fashion according to pulse-width modulation signals controlled by the Arduino board. In order to visualize the outputted angular position and approximate ranging of the HC-SR04 - Python code was implemented on a Raspberry Pi to create a plan position indicator on a polar plot. This PPI gives the user a way of visualizing the objects that surround the motor and ultrasonic sensor, much like a radar approximates the objects surrounding its base station. Several skills used in this tutorial can be applied to real-world applications, whether through obstacle detection, motor control, distancing and ranging, or even a new tool for visualizing data.
See More in Arduino and Python: