Arduino Light Sensor - TSL2561 and Experiments with Infrared and Visible Light
Albert Einstein won his Nobel Prize in Physics in 1921 "for his services to Theoretical Physics, and especially for his discovery of the law of the photoelectric effect" [nobelprize.org]. The photoelectric effect, in part, describes the energetic response from photons and electrons regarding the interaction between light and materials. A photodiode is a device that employs this effect to proportionally measure light as a function of electricity. Photodiodes are used in cameras, smartphones, remote controls, heat sensors, and many other applications. Here, we investigate the TSL2561 luminosity sensor that uses two photodiodes: one in the visible spectrum and one in the infrared spectrum. The goal with the TSL2561 is to demonstrate its responsivity to particular wavelengths (colors) within the electromagnetic spectrum.

Albert Einstein, 1921
The Human Eye and The Electromagnetic Spectrum
The human eye's retina sees by way of cells called photoreceptors. The two primary photoreceptors, rods and cones, allow the eye to see under both dark and bright conditions. The cones resolve bright light and give humans the ability to see colors with wavelengths from 400nm - 700nm (blue to red) [source 1, source 2]. In Table 1, the division of color by wavelength for the visible spectrum is shown.
There three types of cones in the retina: type-S (short wave, blues), type-M (medium wave, greens), type-L (long wave, reds). Figure 1 shows the perceived response of each cone and their relevance to the visible spectrum.
![Table 1: Division of colors by wavelength [source].](https://images.squarespace-cdn.com/content/v1/59b037304c0dbfb092fbe894/1524332692810-KJ5R5G4AOB2AW5Y9XJAA/visible_spectrum_table.png)
Table 1: Division of colors by wavelength [source].

Figure 1: Human Eye Cone Responses
Understanding the behavior of each photoreceptor cone gives scientists and researchers the ability to study and approximate the response of the human eye. The normalized cone responses shown above are typical for an average human retina. The peaks and widths of each curve allow technology companies to build sensors that measure light in a similar manner. Thus, we have devices such as the TSL2561, which measures light roughly in the visible spectrum. Normally, photodiodes experience interference due to the ubiquity of infrared radiation, however, the TSL2561 overcomes this by including an entirely separate photodiode with a peak response in the infrared. This allows the infrared cross-talk to be algorithmically subtracted from the visible measurement to create a more accurate depiction of how much light a human may be perceiving.
Parts List and Experimental Procedure
I will be testing the response of the TSL2561 luminosity sensor by using six LEDs of various wavelengths: infrared (940nm), red (620nm), yellow (580nm), green (520nm), blue (460nm), and white (around 550nm, though it's more broadband). Using these six bands I will be able to verify the responsivity shown in Figure 2 (taken from the datasheet).
I will be using the following parts to conduct the experiment:

Figure 2: Responsivity of the TSL2561 luminosity sensor. In the experiments below, I will be testing this curve using six LEDs of varying wavelength.

Figure 3: Setup of experimental procedure where I measure the visible and infrared signals from each LED.
The experimental procedure will go as follows:
Wire each LED to the circuit
Measure visible and infrared values from the TSL2561
Evaluate Ratio of Visible/Infrared
A photo of my setup for the experiment can be seen in Figure 3.

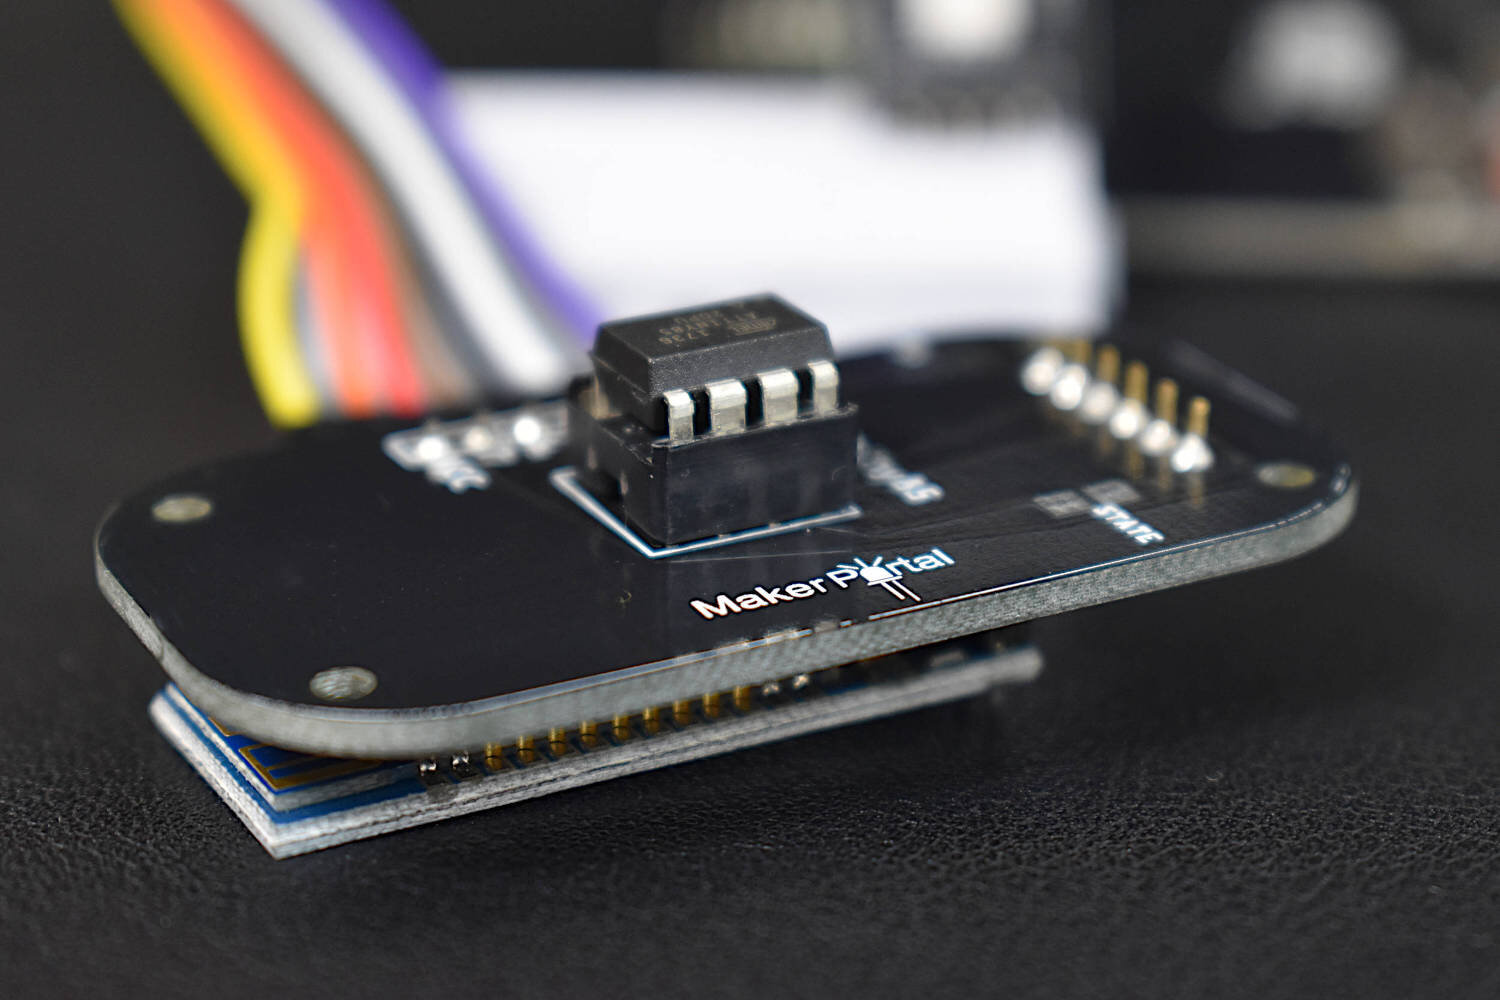
Figure 4: Photo showing both photodiodes on the TSL2561

The TSL2561 SparkFun Library and Arduino Wiring and Code
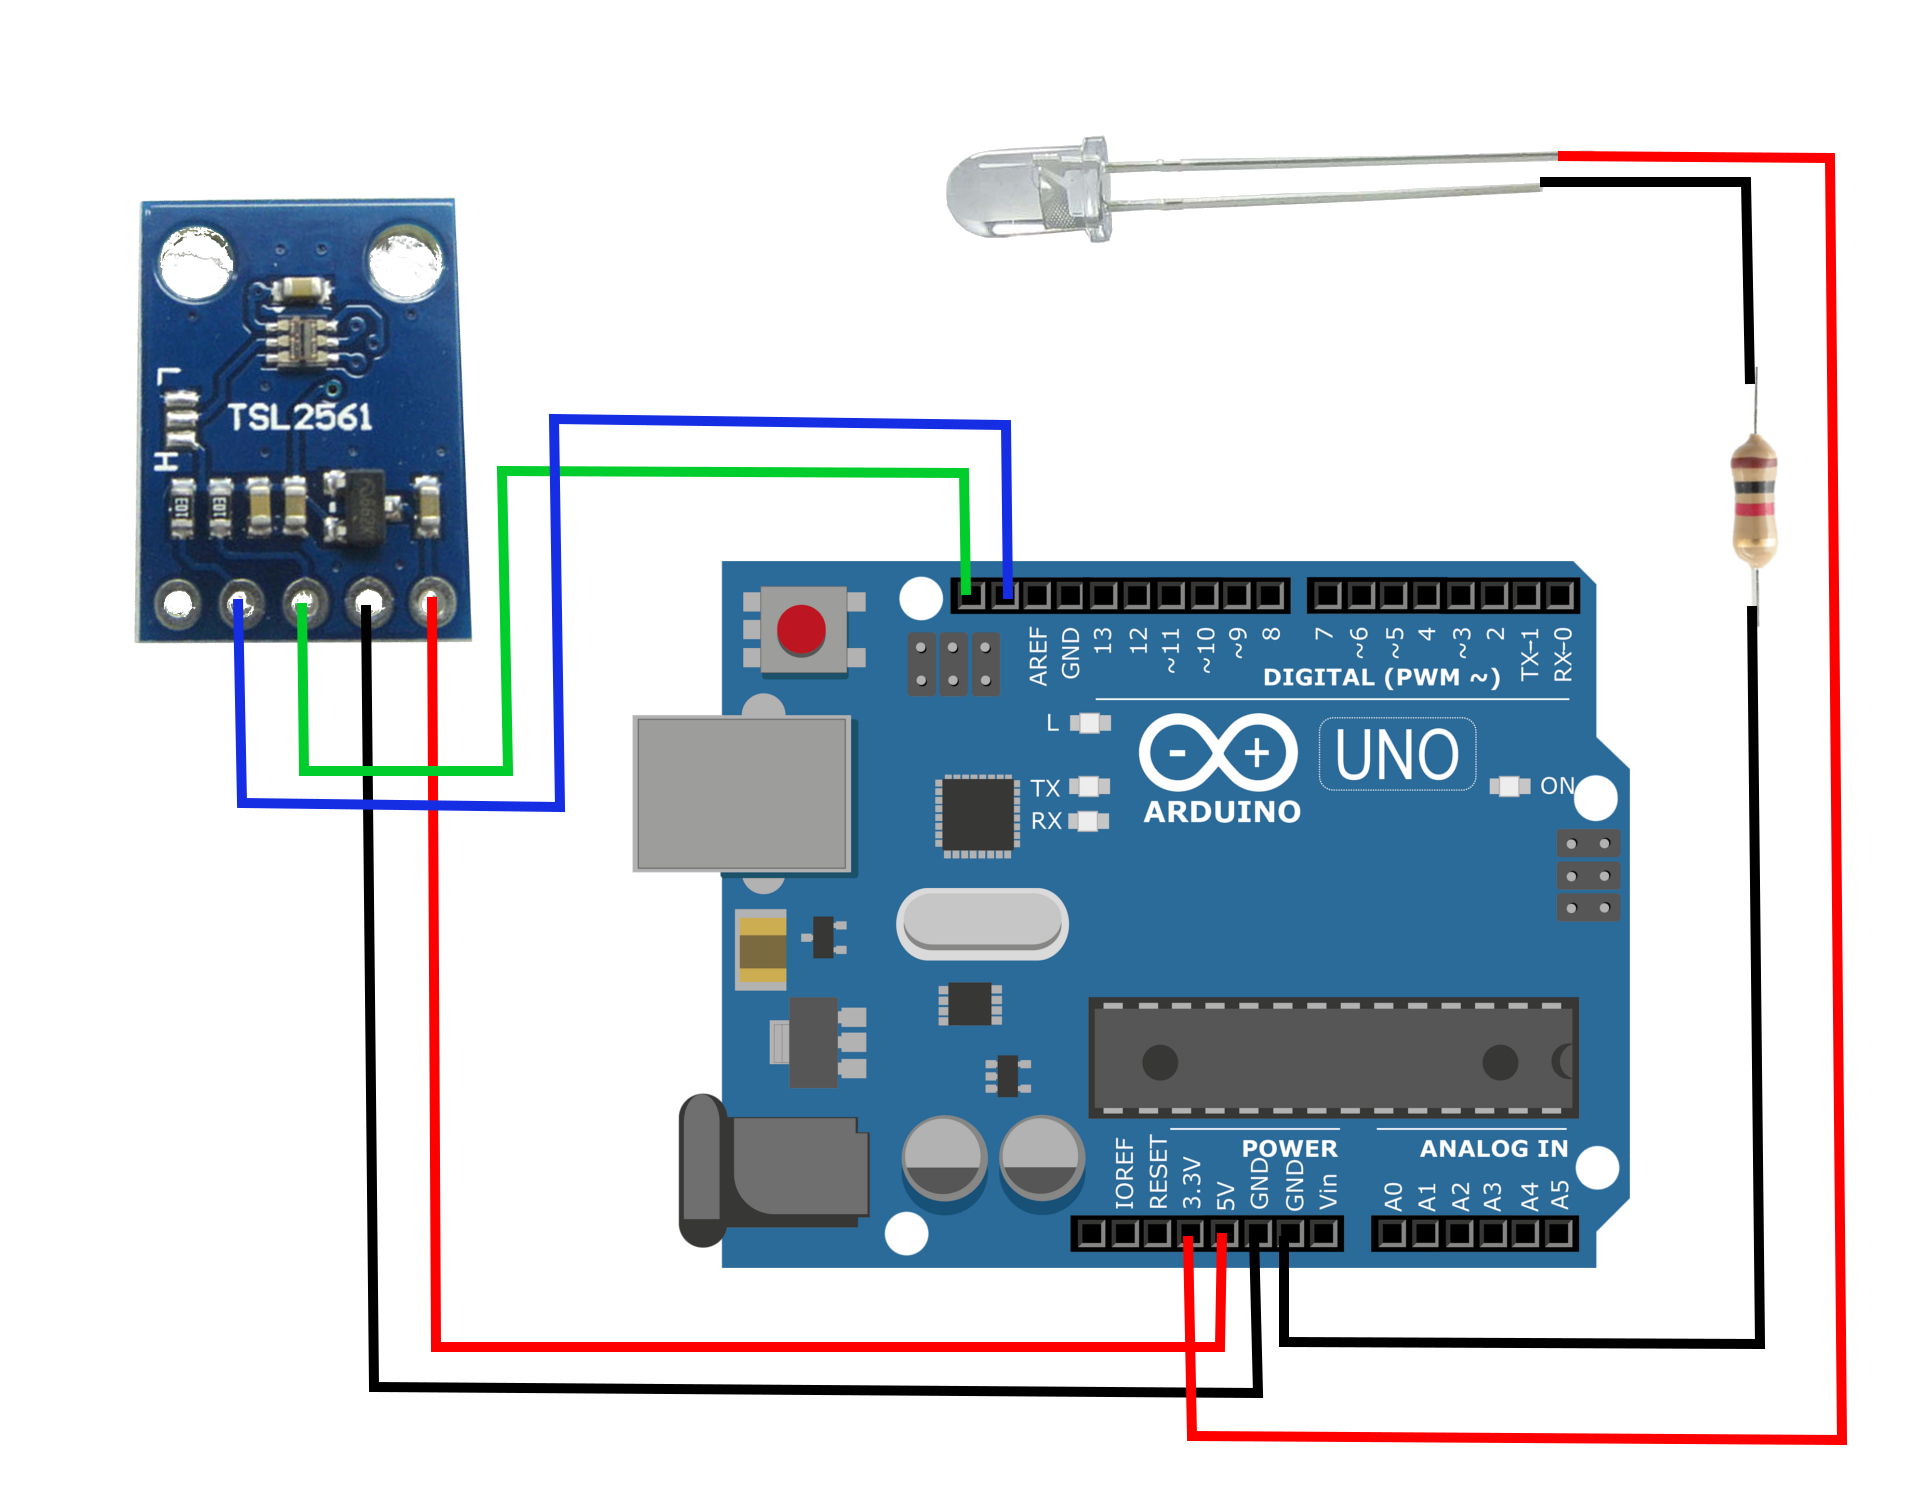
Figure 5: TSL2561 Wiring to Arduino
Arduino | TSL2561
5V | VCC
GND | GND
SCL | SCL
SDA | SDA
I will be using a modified version of the SparkFun example where I only use the raw values measured from the sensor, as opposed to the 'lux' values calculated by the library. The raw values will allow us to compare the visible and infrared light measured by each photodiode. By calculating the ratio between visible and infrared light, we can discern where the light falls on the spectrum based on the response of each photodiode shown in Figure 2. My Arduino code for calculating visible, infrared, and the ratio between the two can be found below:
#include <SparkFunTSL2561.h>
#include <Wire.h>

// Create an SFE_TSL2561 object, here called "light":
SFE_TSL2561 light;

// Global variables:
boolean gain;     // Gain setting, 0 = X1, 1 = X16;
unsigned int ms;  // Integration ("shutter") time in milliseconds

void setup()
{
  // Initialize the Serial port:
  Serial.begin(9600);
  light.begin();

  // If gain = false (0), device is set to low gain (1X)
  // If gain = high (1), device is set to high gain (16X)
  gain = 1;

  // If time = 0, integration will be 13.7ms
  // If time = 1, integration will be 101ms
  // If time = 2, integration will be 402ms
  // If time = 3, use manual start / stop to perform your own integration
  unsigned char time = 2;

  // setTiming() will set the third parameter (ms) to the
  // requested integration time in ms (this will be useful later):
  light.setTiming(gain,time,ms);

  // To start taking measurements, power up the sensor:
  light.setPowerUp();
}

void loop()
{
  delay(ms);
  // Retrieve the data from the device:
  unsigned int visible, infrared;
  float vis,ir

  if (light.getData(visible,infrared))
  {
    // getData() returned true, communication was successful
    Serial.print("Visible: ");
    Serial.print(visible);
    Serial.print(" Infrared: ");
    Serial.print(infrared);
    vis = float(visible);
    ir = float(infrared);
    Serial.print(" Ratio (Vis/IR): ");
    Serial.println(vis/ir);
  }
  else
  {
    // getData() returned false because of an I2C error, inform the user.
    byte error = light.getError();
    Serial.print("I2C error: ");
    Serial.println(error);
  }
}
Experimental Results
The table below shows the calculated ratios between visible and infrared light for each LED. The trend in the data can easily be deduced, and the physical significance of this trend is obvious and expected. Since the two photodiodes peak at different wavelengths, the visible around 650nm and the infrared around 800nm, we are able to utilize their ratio and relate it to the wavelength of light being emitted. Therefore, it can be concluded that under controlled conditions, the TSL2561 is capable of discerning the color of each LED with only a measure of emission.
| LED | Ratio (Visible/Infrared) |
|---|---|
| IR (940nm) | 1.3 |
| Red (620nm) | 5.8 |
| Yellow (580nm) | 9.3 |
| White (~550nm) | 16.8 |
| Green (520nm) | 25.6 |
| Blue (460nm) | 95.8 |

I conducted a polynomial fitting of the data after casting the ratios as a function of the natural logarithm. This accounts for the exponential profile of the two photodiode responses. I then plotted the fit against the data and acquired a nice expression for approximating the wavelength as a function of the measured ratio of visible light to infrared light detected by the TSL2561 luminosity sensor.

With the fit above, I was able to replicate the data with near-perfect accuracy. This means that we can insert the polynomial fit (and exponential inversion) into Arduino and actually re-do the experiment and blindly be able to determine the color of a given LED. This type of result could have massive implications in applications involving color recognition.
Conclusion
In the experiment executed above I demonstrated the effectiveness of a pair of photodiodes using the TSL2561 luminosity sensor. Using the Arduino Uno, I was able to calculate the ratio between the visible and infrared light emitted by LEDs of varying wavelengths. The results indicate that the TSL2561 is capable of distinguishing between colors based on the measured ratio between the photodiodes. This outcome has broad implications for makers interested in the TSL2561 as a light sensor and color detector. The experiment is also educational for students interested in learning about the photoelectric effect and how the human eye perceives light and colors. Obviously, complications can arise when dealing with light being emitted from multiple locations and direction, and therefore, the conclusions drawn above cannot necessarily be extrapolated to every situation.
Products from our Shop relevant to this project:


See more in Arduino and Physics: