High Resolution Thermal Camera with Raspberry Pi and MLX90640
“As an Amazon Associates Program member, clicking on links may result in Maker Portal receiving a small commission that helps support future projects.”
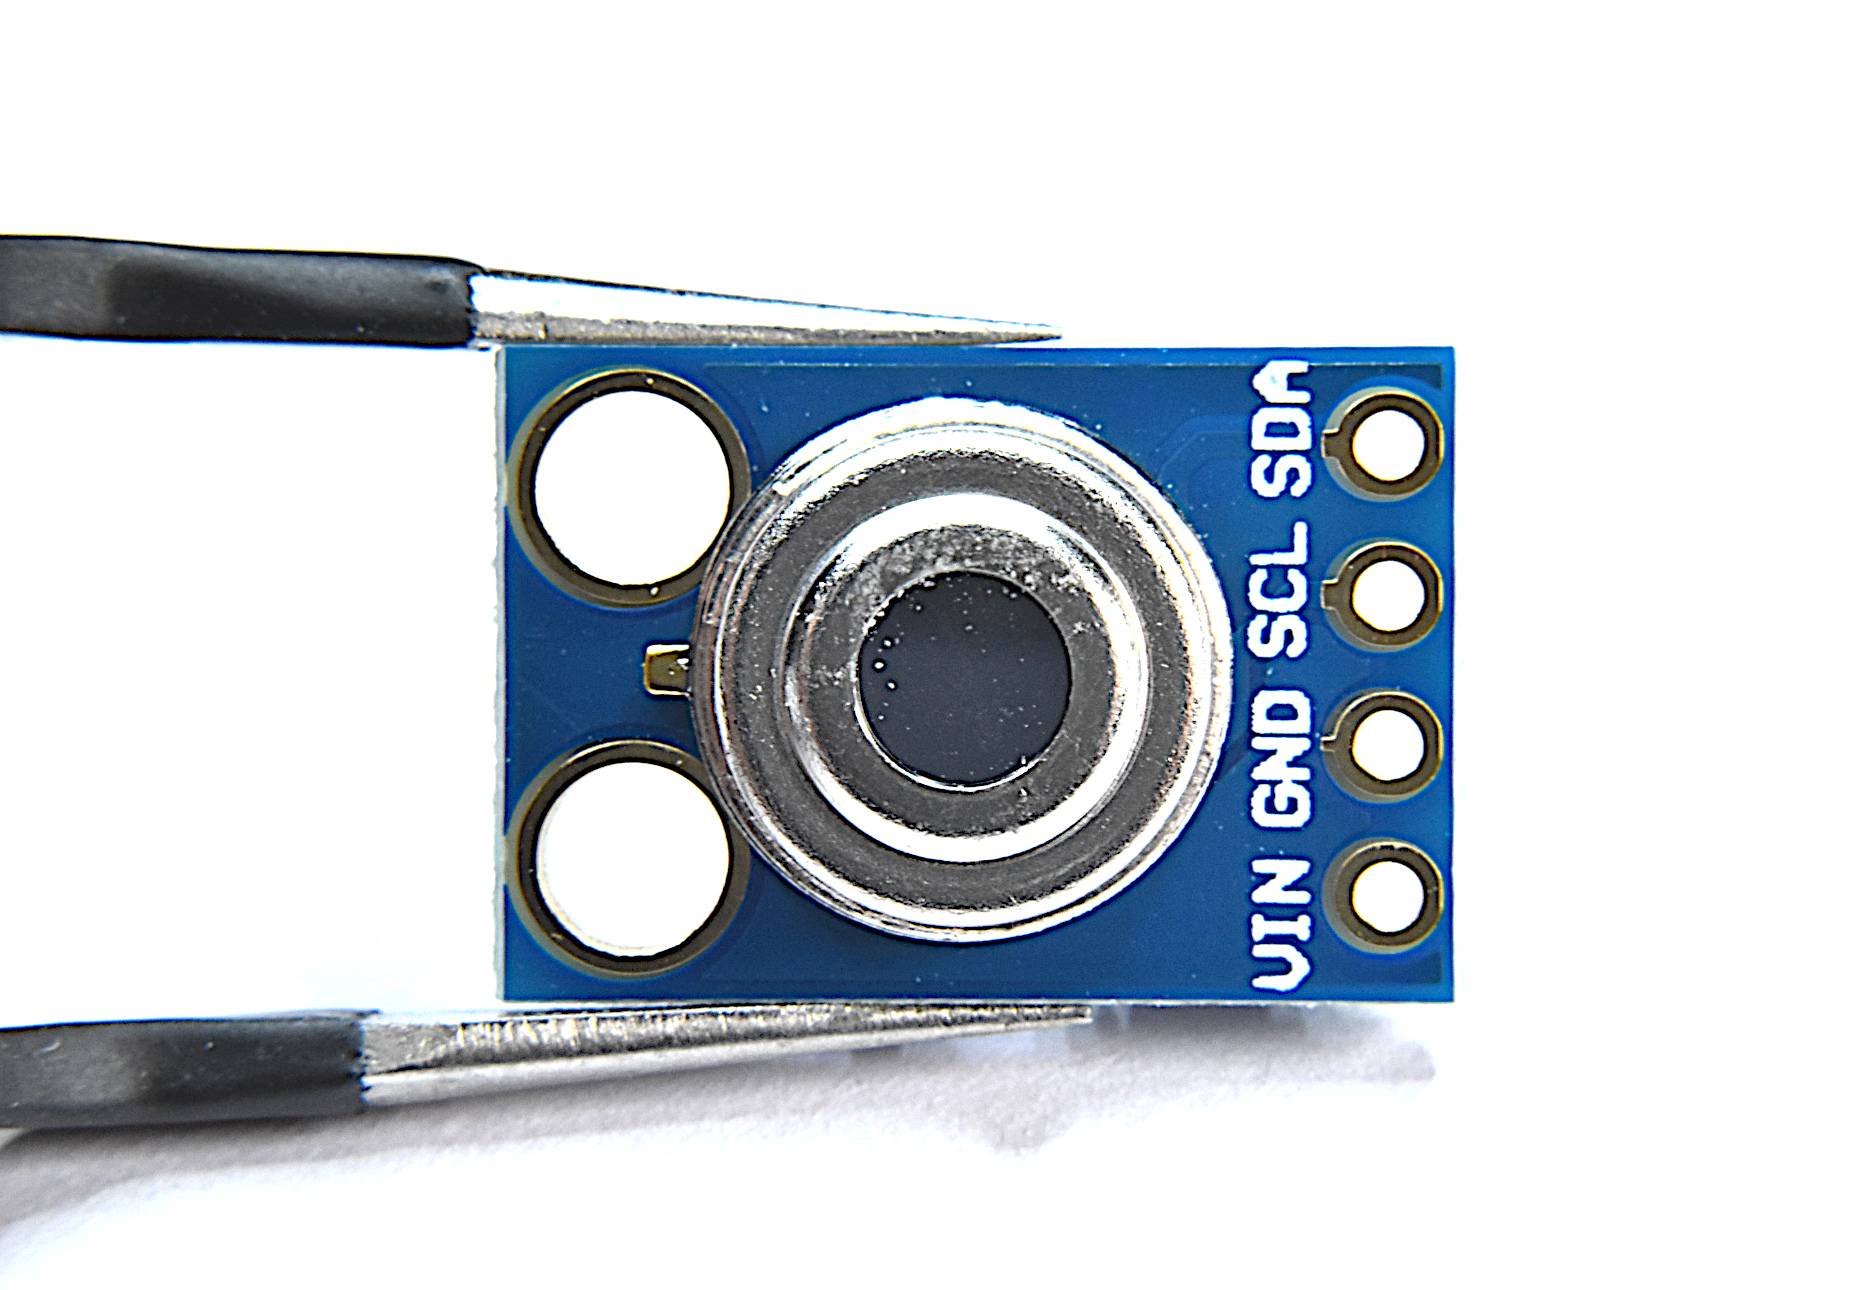
Thermal cameras are similar to standard cameras in that they use light to record images. The most significant distinction is that thermal cameras detect and filter light such that only the infrared region of the electromagnetic spectrum is recorded, not the visible region [read more about infrared cameras here and https://thermalcameras.guide]. Shortly after the discovery of the relationship between radiation and the heat given off by black bodies, infrared detectors were patented as a way to predict temperature via non-contact instrumentation [see this patent from 1939 as an example]. In recent decades, as integrated circuits shrink in size, infrared detectors have become commonplace in applications of non-destructive testing, medical device technology, and motion detection of heated bodies. The sensor used here is the MLX90640 [datasheet], which is a 768 pixel (24x32) thermal camera. It uses an array of infrared detectors (and likely filters) to detect the radiation given off by objects. Along with a Raspberry Pi computer, the MLX90640 will be used to map and record fairly high-resolution temeperature maps. Using Python, we will be able to push the RPI to its limits by interpolating the MLX90640 to create a 3 frame-per-second (fps) thermal camera at 240x320 pixel resolution.
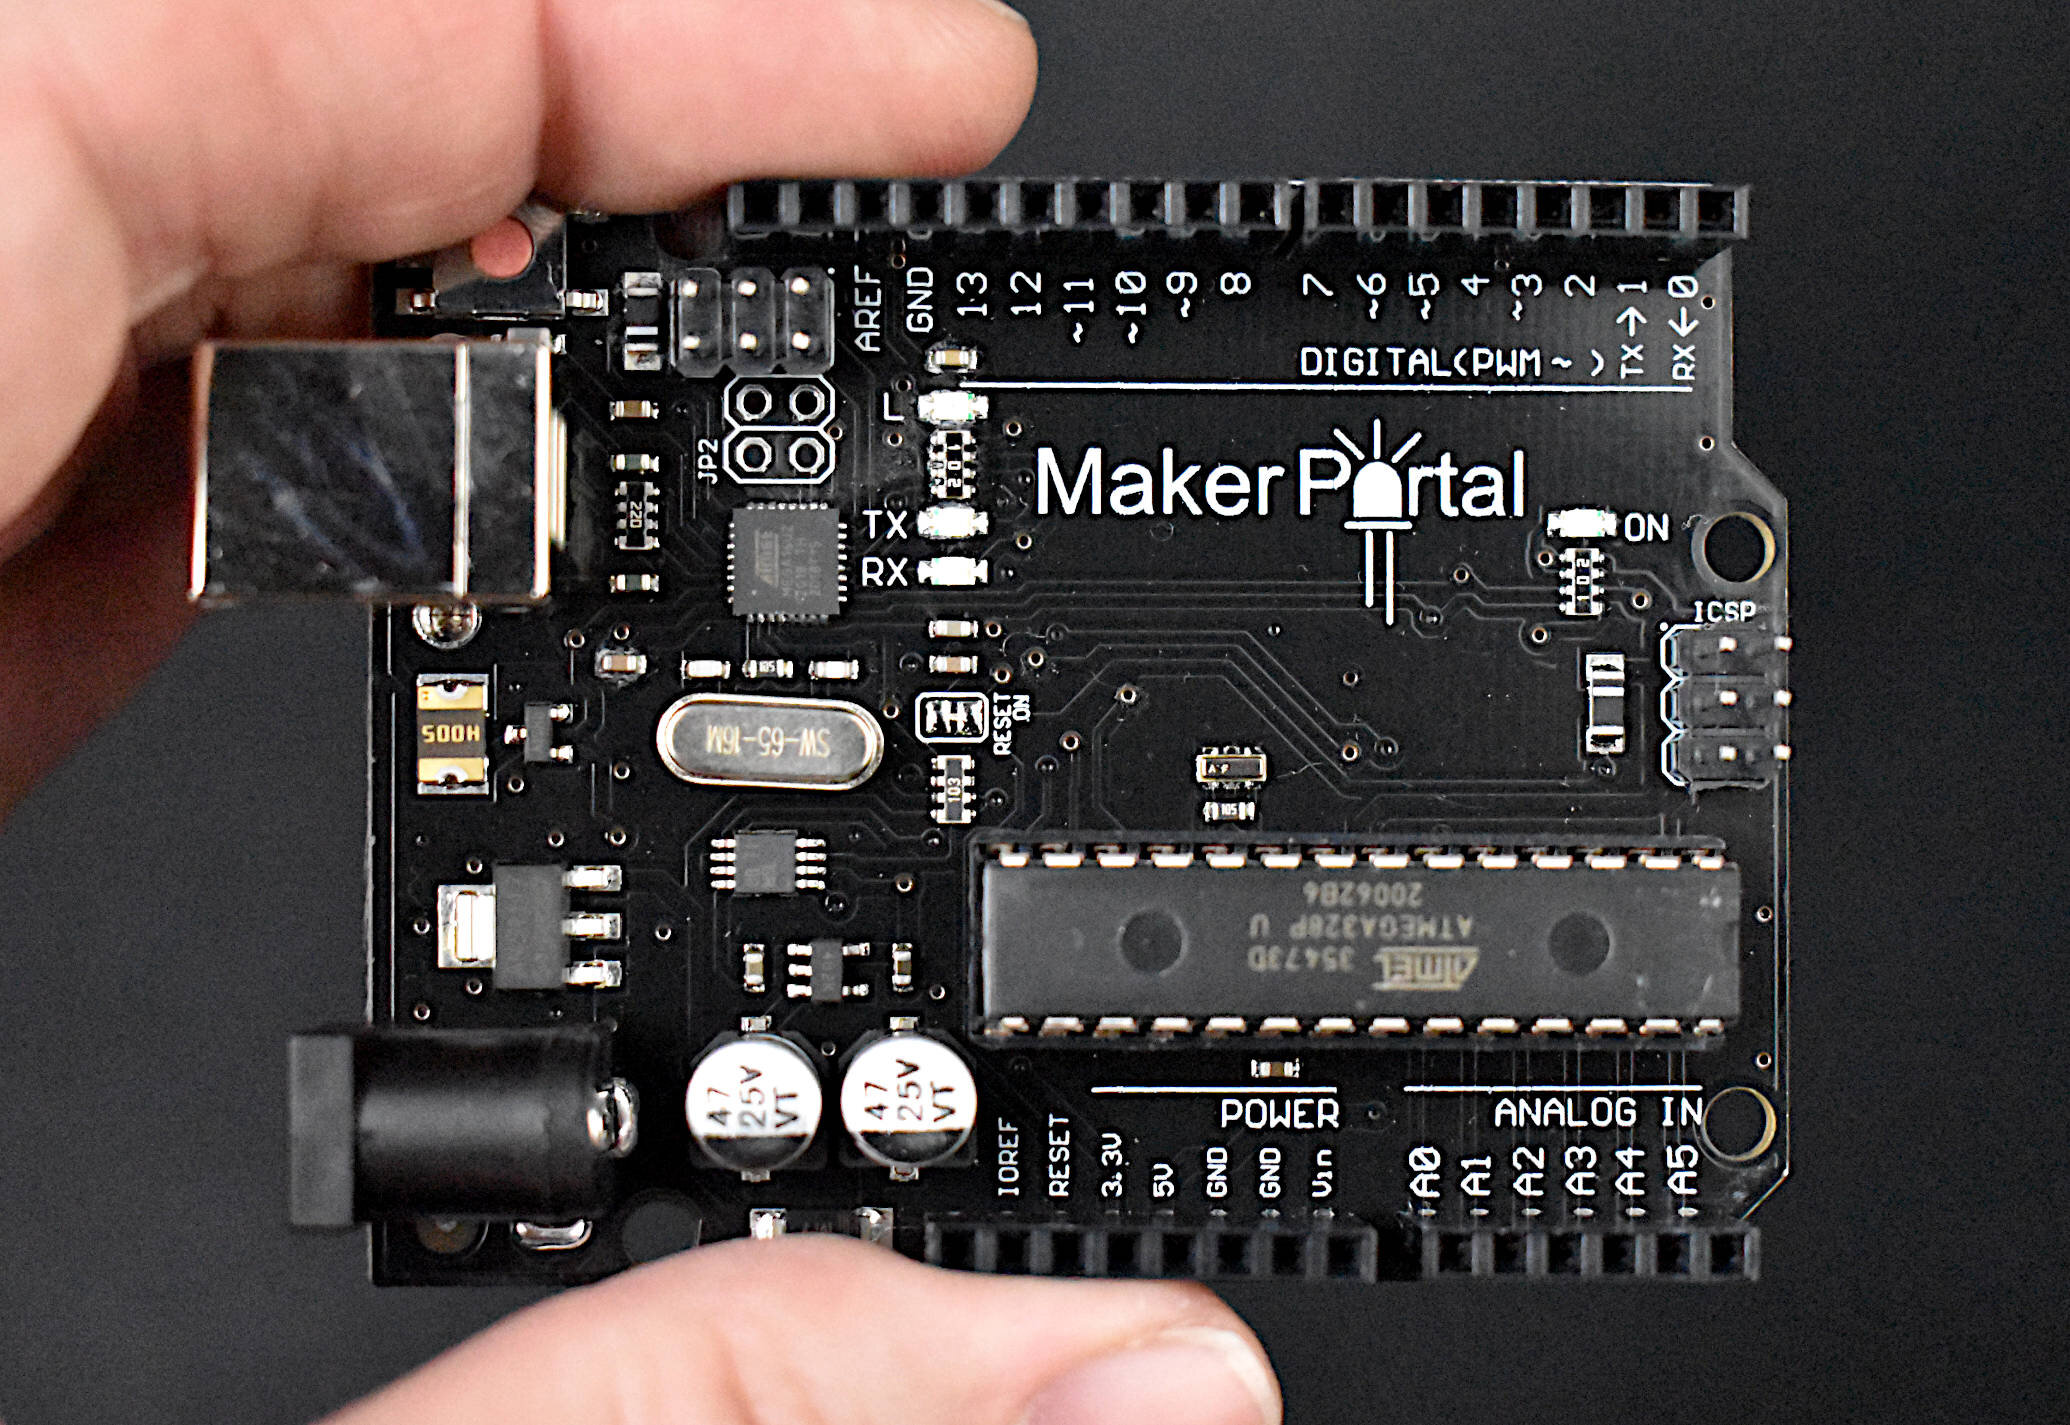
The parts list required for this tutorial is straight forward: a Raspberry Pi and MLX90640. A Raspberry Pi 4 will be used to take advantage of the faster processing power, which will allow a roughly 3 frames-per-second (fps) visualization of all 768 pixels of the MLX90640. Some links for the RPI and MLX IR camera are given below for reference:
MLX90640 Thermal Camera - $178.99 [Amazon], $90.00 [Our Store]
Raspberry Pi 4 Computer - $60.95 [Amazon], $55.00 [2GB from Our Store]
At the time of writing, the MLX90640 IR camera is fairly pricey due to high demand (surely due to the COVID-19 crisis), however, we have sourced some from one of our partners. It is now on our store and available for purchase. For comparison, the popular AMG8833 and lower resolution thermal camera (8x8 pixel) is roughly $40-$50.

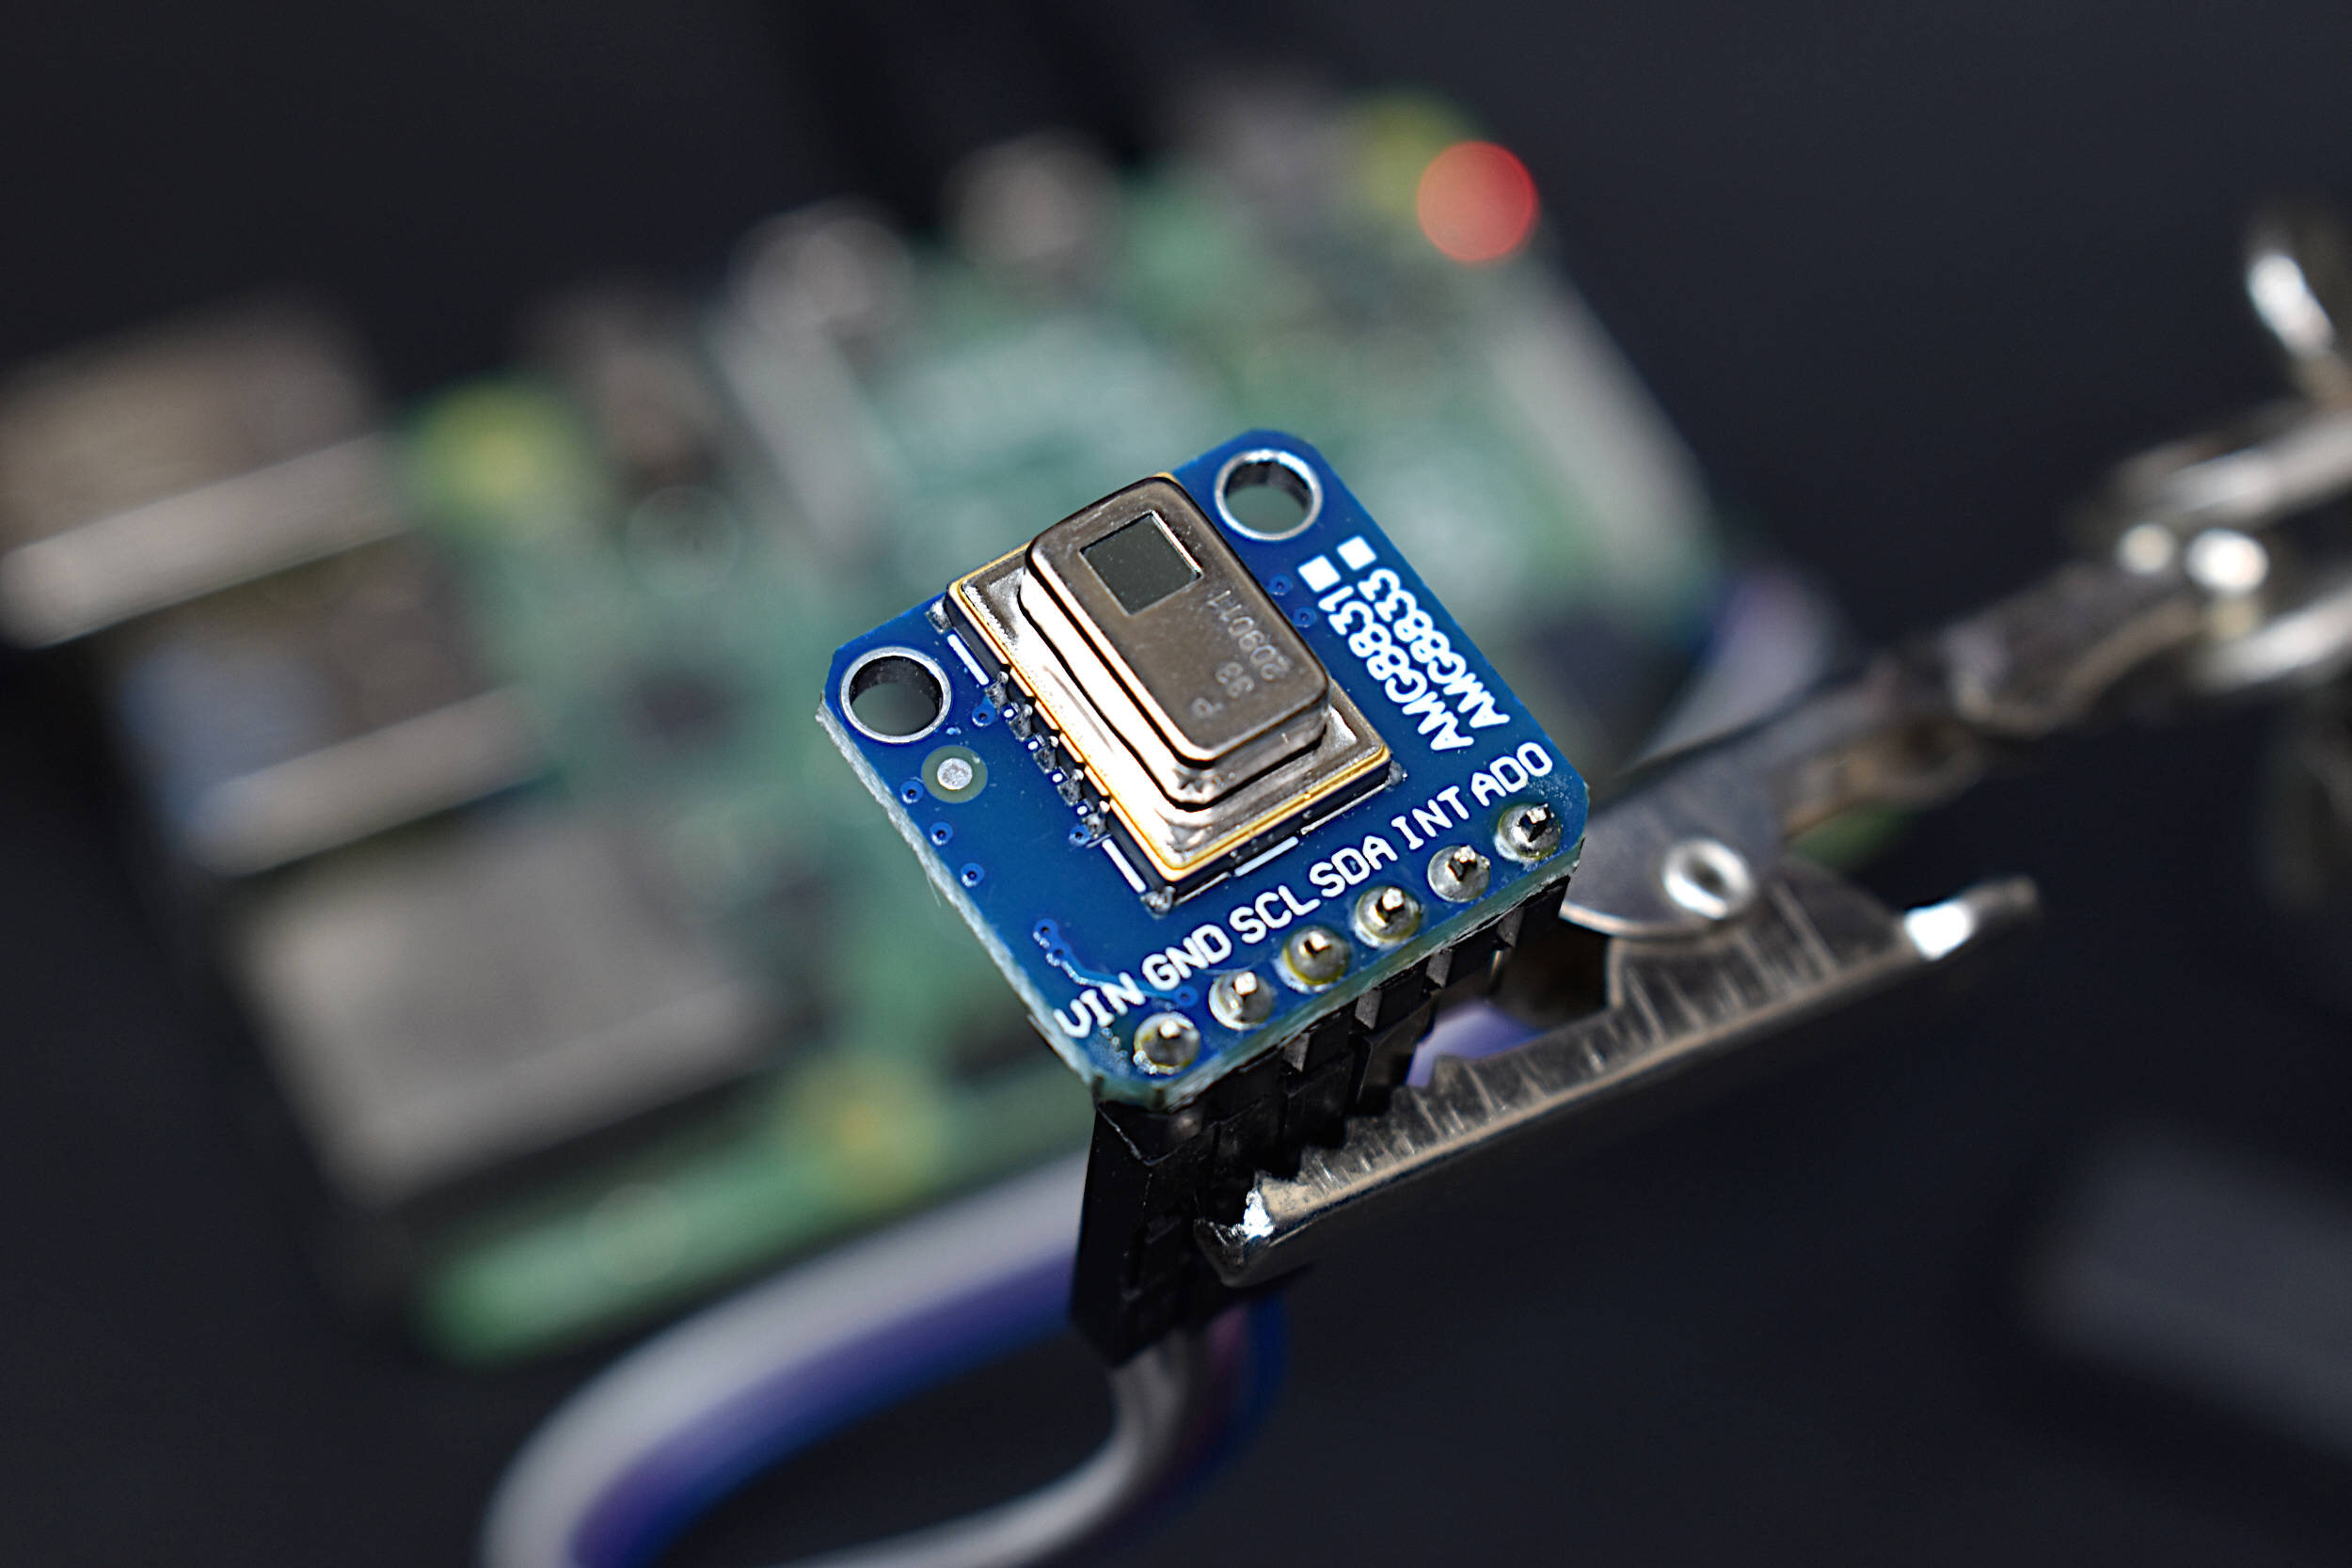
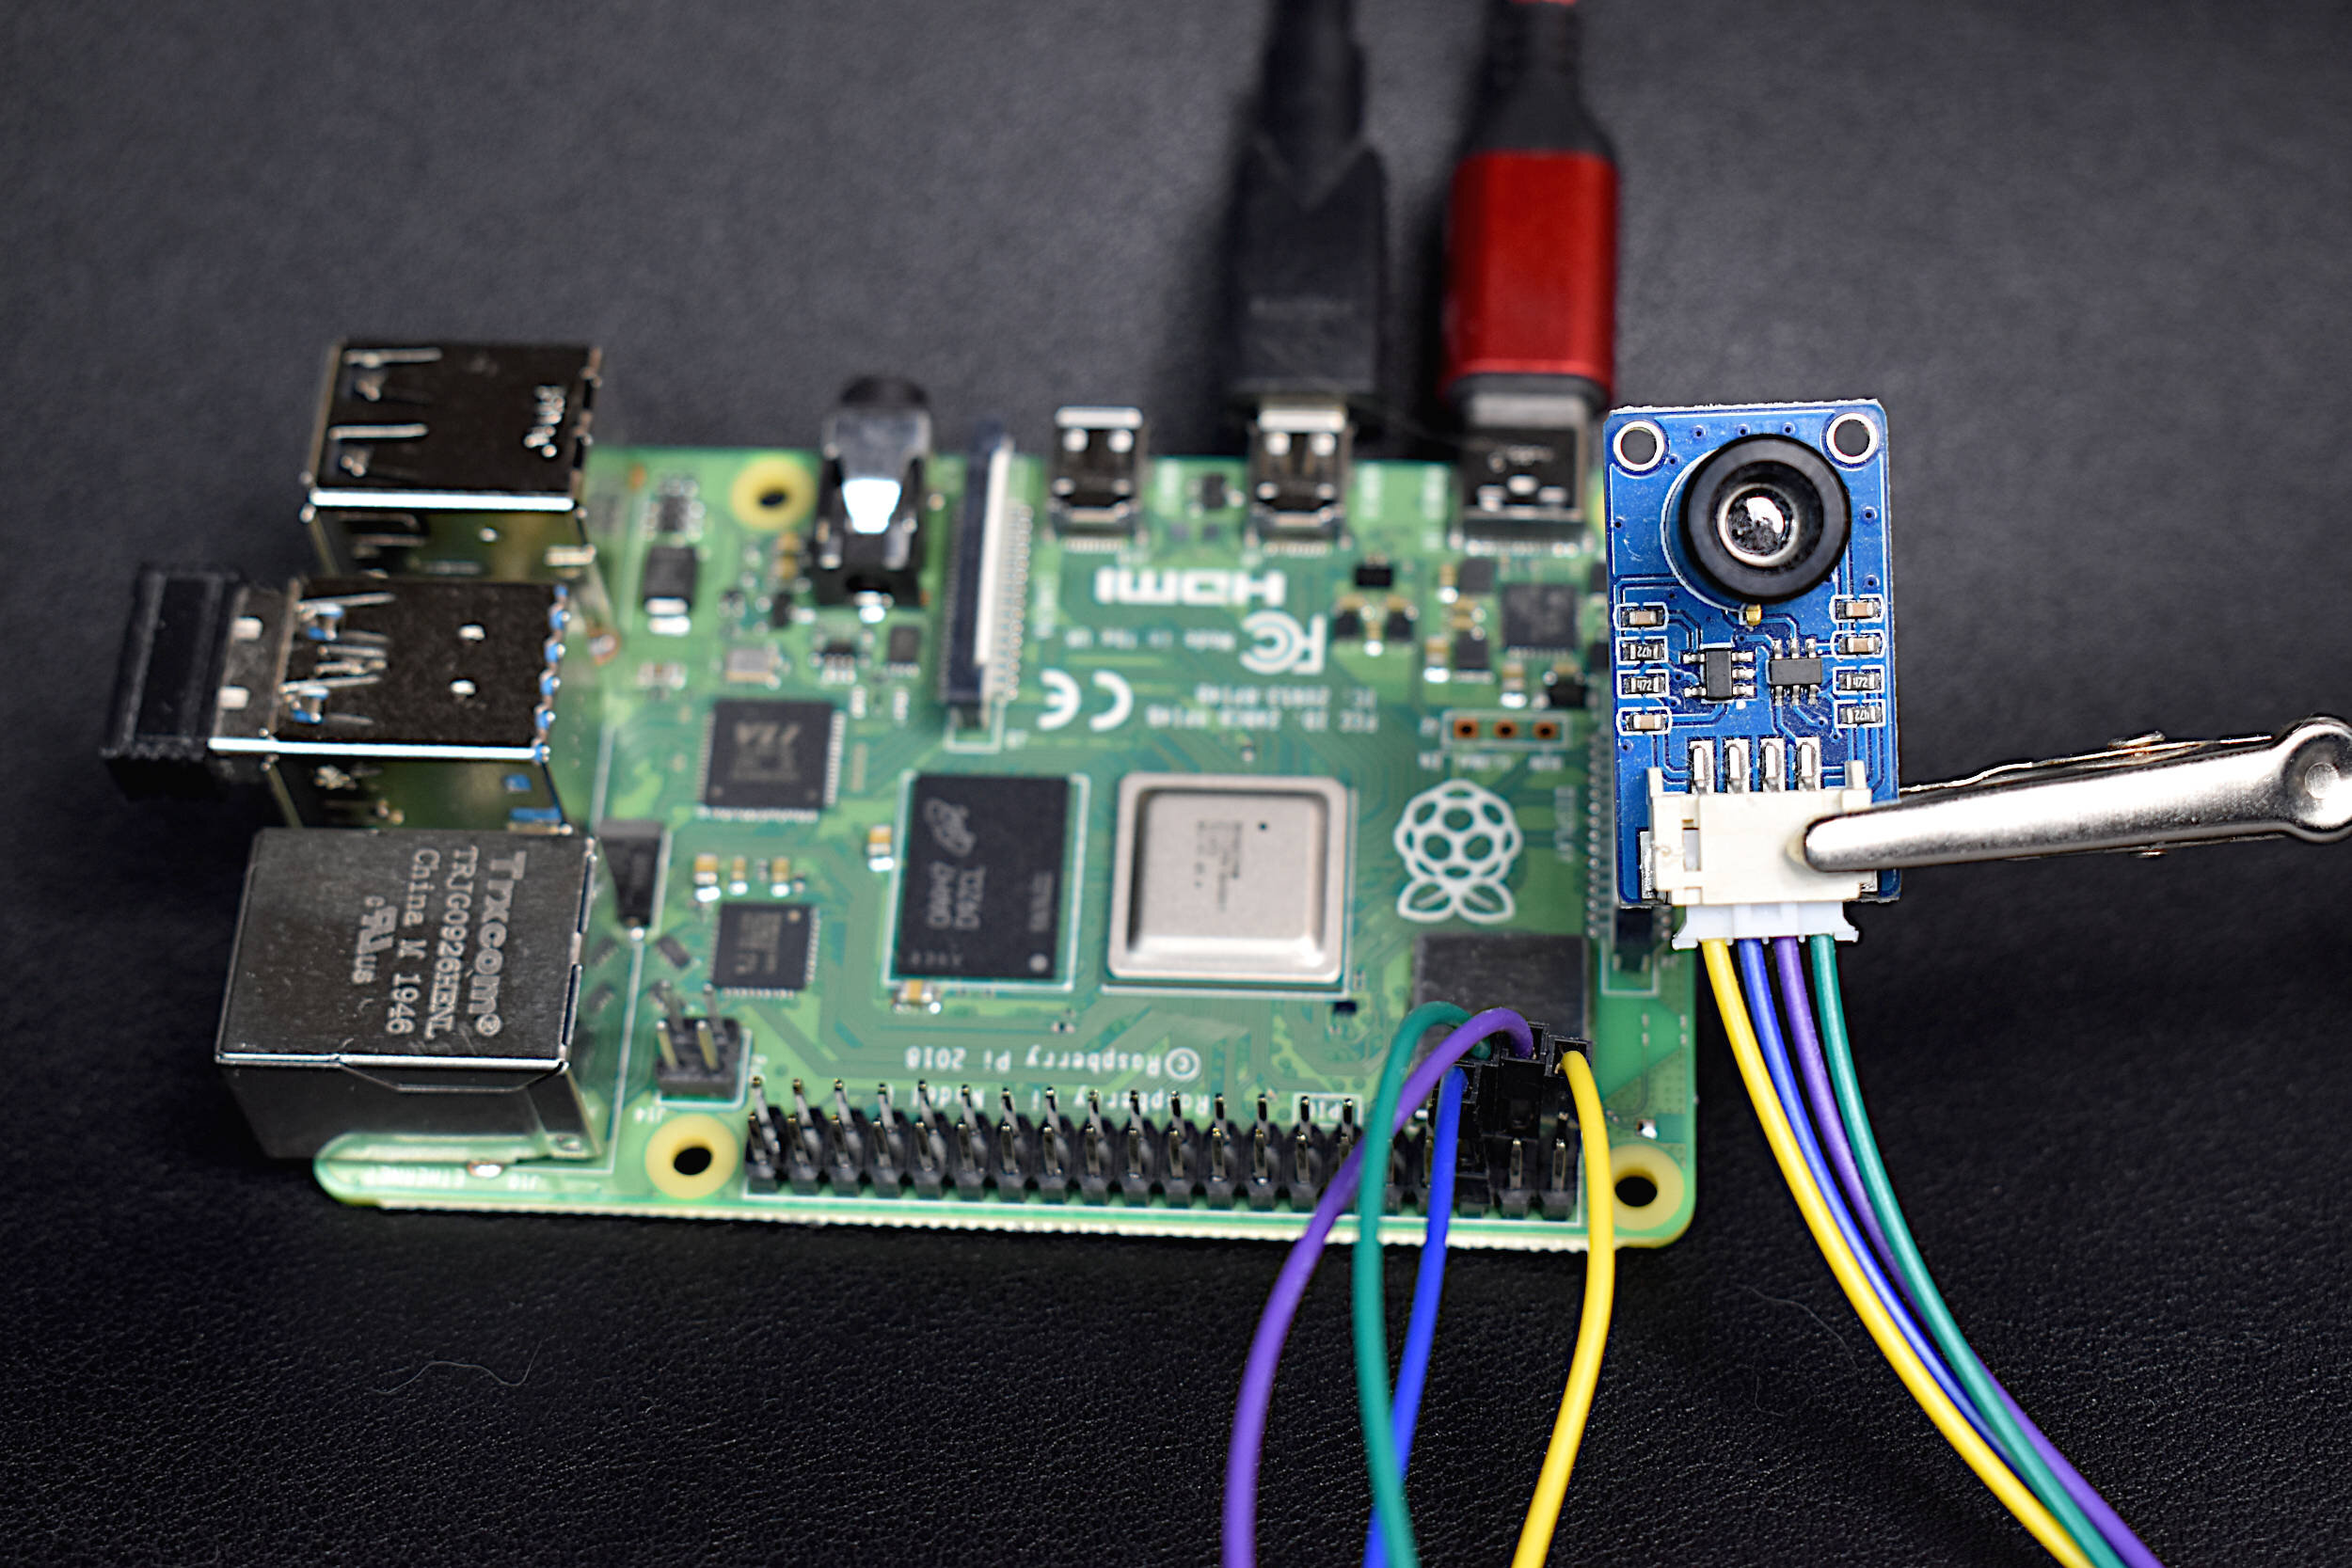
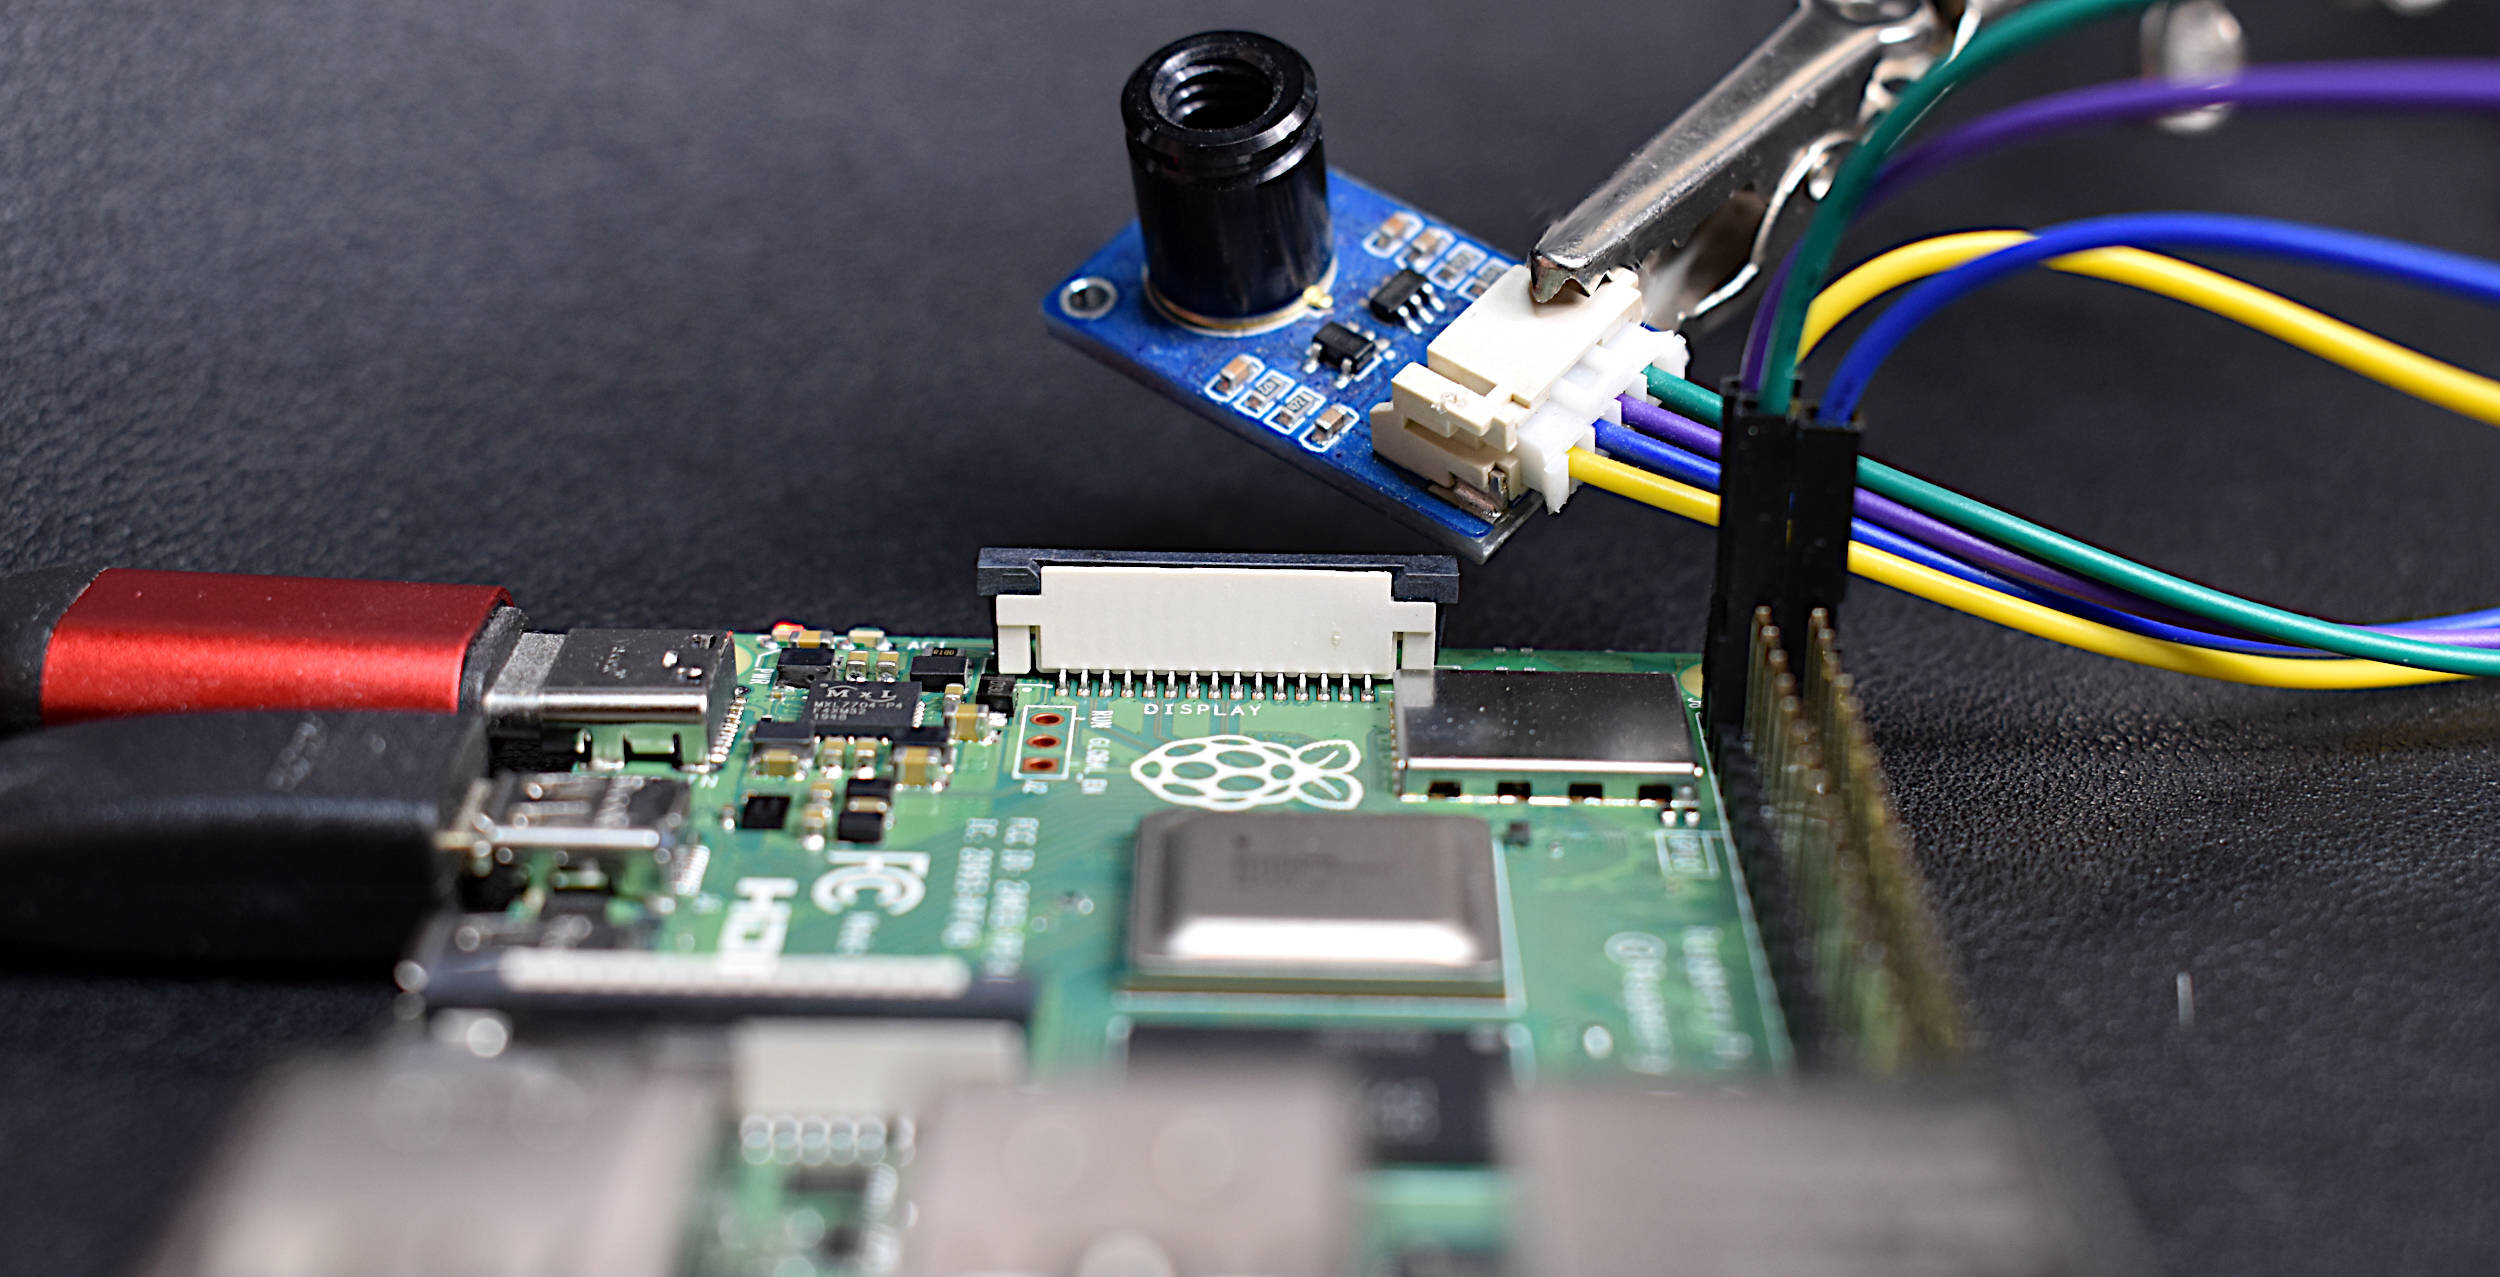
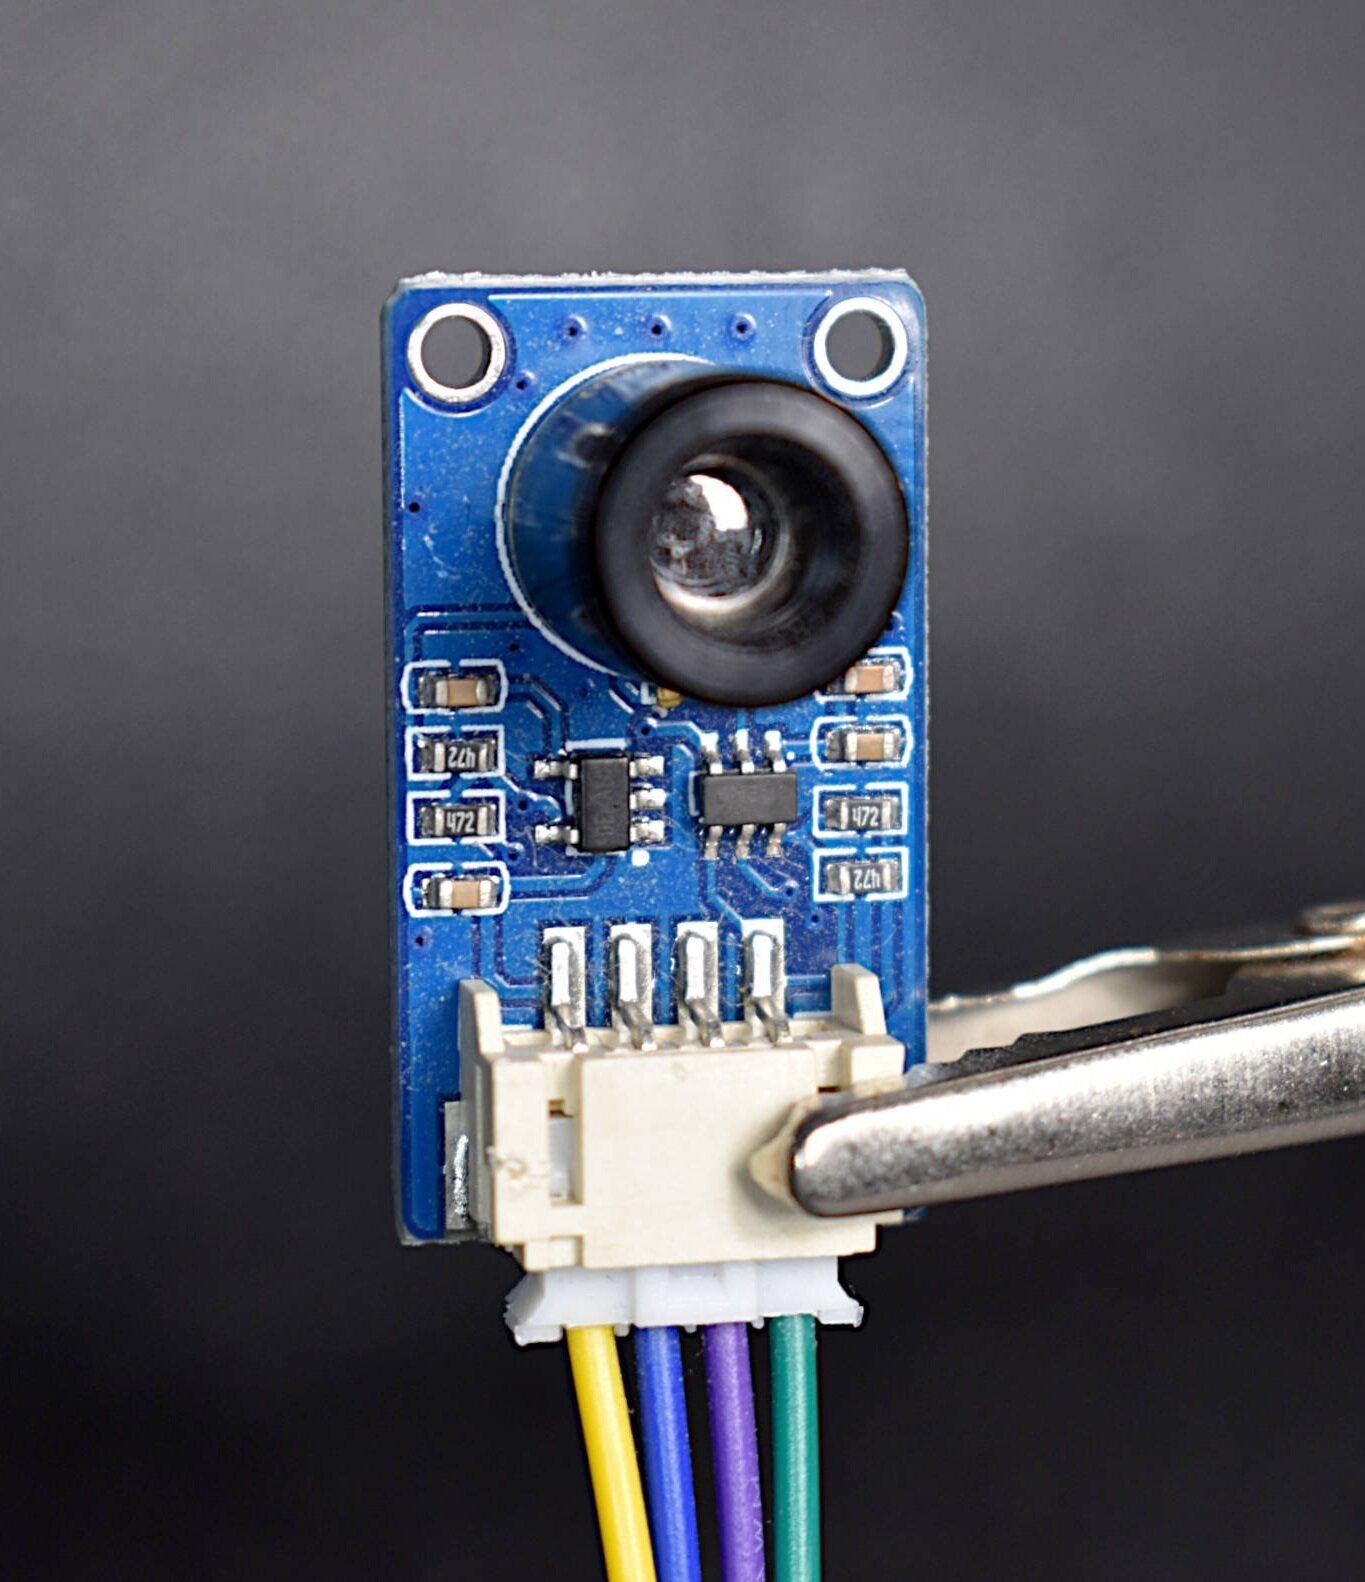
Wiring the MLX90640 to a Raspberry Pi board is also given below (The wiring for the module in our store is identical). Custom PCB designs can also be found at places like Ray PCB, where they are capable of integrating the MLX90640 and Raspberry Pi directly onto one PCB. Below is the direct wiring between the module and RPi 4:

The MLX90640 and Raspberry Pi communicate via the I2C protocol, which uses the hardware pins 3/5 on the Pi (SDA/SCL).
The Adafruit library will be used to read the MLX90640 thermal breakout board (though we’re using the Waveshare board). The following commands should be inputted into the terminal on the Raspberry Pi to ensure that the MLX90640 sensor can be visualized in Python [based on Adafruit’s tutorial]:
pi@raspberrypi:~ $ sudo pip3 install matplotlib scipy numpy
Additionally, the RPi needs I2C tools installed:
pi@raspberrypi:~ $ sudo apt-get install -y python-smbus
pi@raspberrypi:~ $ sudo apt-get install -y i2c-tools
Also ensure that the I2C is enabled (via the terminal here):
pi@raspberrypi:~ $ sudo nano /boot/config.txt
This should open up the boot file on the RPi. Scroll down to the dtparam=i2c_arm=on and make sure that it is uncommented:

With the I2C now enabled, reboot the RPi:
pi@raspberrypi:~ $ sudo reboot
Once the RPi restarts, assuming the MLX90640 is wired correctly, we can check the I2C port and ensure that the RPi registers the MLX90640. This can be done with the following command:
pi@raspberrypi:~ $ sudo i2cdetect -y 1
The following should be printed out on the terminal:

The number 33 printed out, which is the I2C address of the MLX90640 (0x33). This can be confirmed by looking at the MLX90640 datasheet.
At this point, the MLX90640 is ready to be read by the Raspberry Pi. However, since the Adafruit library is being used, a few other libraries need to be installed:
pi@raspberrypi:~ $ sudo pip3 install RPI.GPIO adafruit-blinka
pi@raspberrypi:~ $ sudo pip3 install adafruit-circuitpython-mlx90640
Next, the Python Integrated Development and Learning Environment (IDLE) is installed, but not necessarily required. An anaconda environment could also be used, but since the RPi is used here, we chose IDLE (for Python 3). IDLE, if not installed already, can be installed as follows:
pi@raspberrypi:~ $ sudo apt-get install idle3
Finally, open up IDLE or Anaconda and attempt to import the MLX90640 library from Adafruit using the following test code:
##################################
# MLX90640 Test with Raspberry Pi
##################################
#
import time,board,busio
import numpy as np
import adafruit_mlx90640

i2c = busio.I2C(board.SCL, board.SDA, frequency=400000) # setup I2C
mlx = adafruit_mlx90640.MLX90640(i2c) # begin MLX90640 with I2C comm
mlx.refresh_rate = adafruit_mlx90640.RefreshRate.REFRESH_2_HZ # set refresh rate

frame = np.zeros((24*32,)) # setup array for storing all 768 temperatures
while True:
    try:
        mlx.getFrame(frame) # read MLX temperatures into frame var
        break
    except ValueError:
        continue # if error, just read again

# print out the average temperature from the MLX90640
print('Average MLX90640 Temperature: {0:2.1f}C ({1:2.1f}F)'.\
      format(np.mean(frame),(((9.0/5.0)*np.mean(frame))+32.0)))
The code above should print out the average temperature read by the MLX90640. Pointing the MLX90640 sensor at the Raspberry Pi and resulted in an average temperature of 42.8°C (109.0°F).
When reading the MLX90640, an error may appear that cites a refresh rate issue. This can be avoided by amping up the rate of the I2C device on the RPi. To do this, we need to change the following back in the ‘config.txt’ file:
pi@raspberrypi:~ $ sudo nano /boot/config.txt
Scrolling down to the uncommented ‘dtparam=i2c_arm=on’ - we also want to add the following line that increases the I2C speed to 1Mbit/s:

Be cautious when increasing the I2C baud rate above the recommended speed (400kbit/s). This high speed can cause overheating of the Pi, so ensure that the board is properly ventilated or actively cooled. In an upcoming section, some routines for plotting the 24x32 temperature grid will be introduced, where this 1Mbit/s will be important for creating a near real-time thermal camera with the MLX90640 sensor.
The datasheet for the MLX90640 demonstrates that the sensor has a top-right starting point for its pixel map, meaning that the first point it logs is the top, right-most point of its viewing window. This is depicted in the drawing below:

MLX90640 View Configuration
This is important for when the output is plotted in Python and will help us get the mapping right in the visualization of the thermal camera. In Python, there are different methods that can be used to visualize the output of the MLX90640. The first is called ‘imshow’ and allows users to view any image. The ‘imshow’ implementation uses a different origin configuration, which technically has its origin at the top-left corner of its window. This means that when we plot the MLX90640 points, the points need to be shifted from left to right, in order to follow the proper mapping of the IR sensor shown above. A simple implementation of the MLX90640 visualization is shown below using ‘imshow’ in Python, with the left-right flipping done in the code:
##########################################
# MLX90640 Thermal Camera w Raspberry Pi
# -- 2Hz Sampling with Simple Routine
##########################################
#
import time,board,busio
import numpy as np
import adafruit_mlx90640
import matplotlib.pyplot as plt

i2c = busio.I2C(board.SCL, board.SDA, frequency=400000) # setup I2C
mlx = adafruit_mlx90640.MLX90640(i2c) # begin MLX90640 with I2C comm
mlx.refresh_rate = adafruit_mlx90640.RefreshRate.REFRESH_8_HZ # set refresh rate
mlx_shape = (24,32)

# setup the figure for plotting
plt.ion() # enables interactive plotting
fig,ax = plt.subplots(figsize=(12,7))
therm1 = ax.imshow(np.zeros(mlx_shape),vmin=0,vmax=60) #start plot with zeros
cbar = fig.colorbar(therm1) # setup colorbar for temps
cbar.set_label('Temperature [$^{\circ}$C]',fontsize=14) # colorbar label

frame = np.zeros((24*32,)) # setup array for storing all 768 temperatures
t_array = []
while True:
    t1 = time.monotonic()
    try:
        mlx.getFrame(frame) # read MLX temperatures into frame var
        data_array = (np.reshape(frame,mlx_shape)) # reshape to 24x32
        therm1.set_data(np.fliplr(data_array)) # flip left to right
        therm1.set_clim(vmin=np.min(data_array),vmax=np.max(data_array)) # set bounds
        cbar.on_mappable_changed(therm1) # update colorbar range
        plt.pause(0.001) # required
        fig.savefig('mlx90640_test_fliplr.png',dpi=300,facecolor='#FCFCFC',
                    bbox_inches='tight') # comment out to speed up
        t_array.append(time.monotonic()-t1)
        print('Sample Rate: {0:2.1f}fps'.format(len(t_array)/np.sum(t_array)))
    except ValueError:
        continue # if error, just read again
The code above should output an image similar to the following:
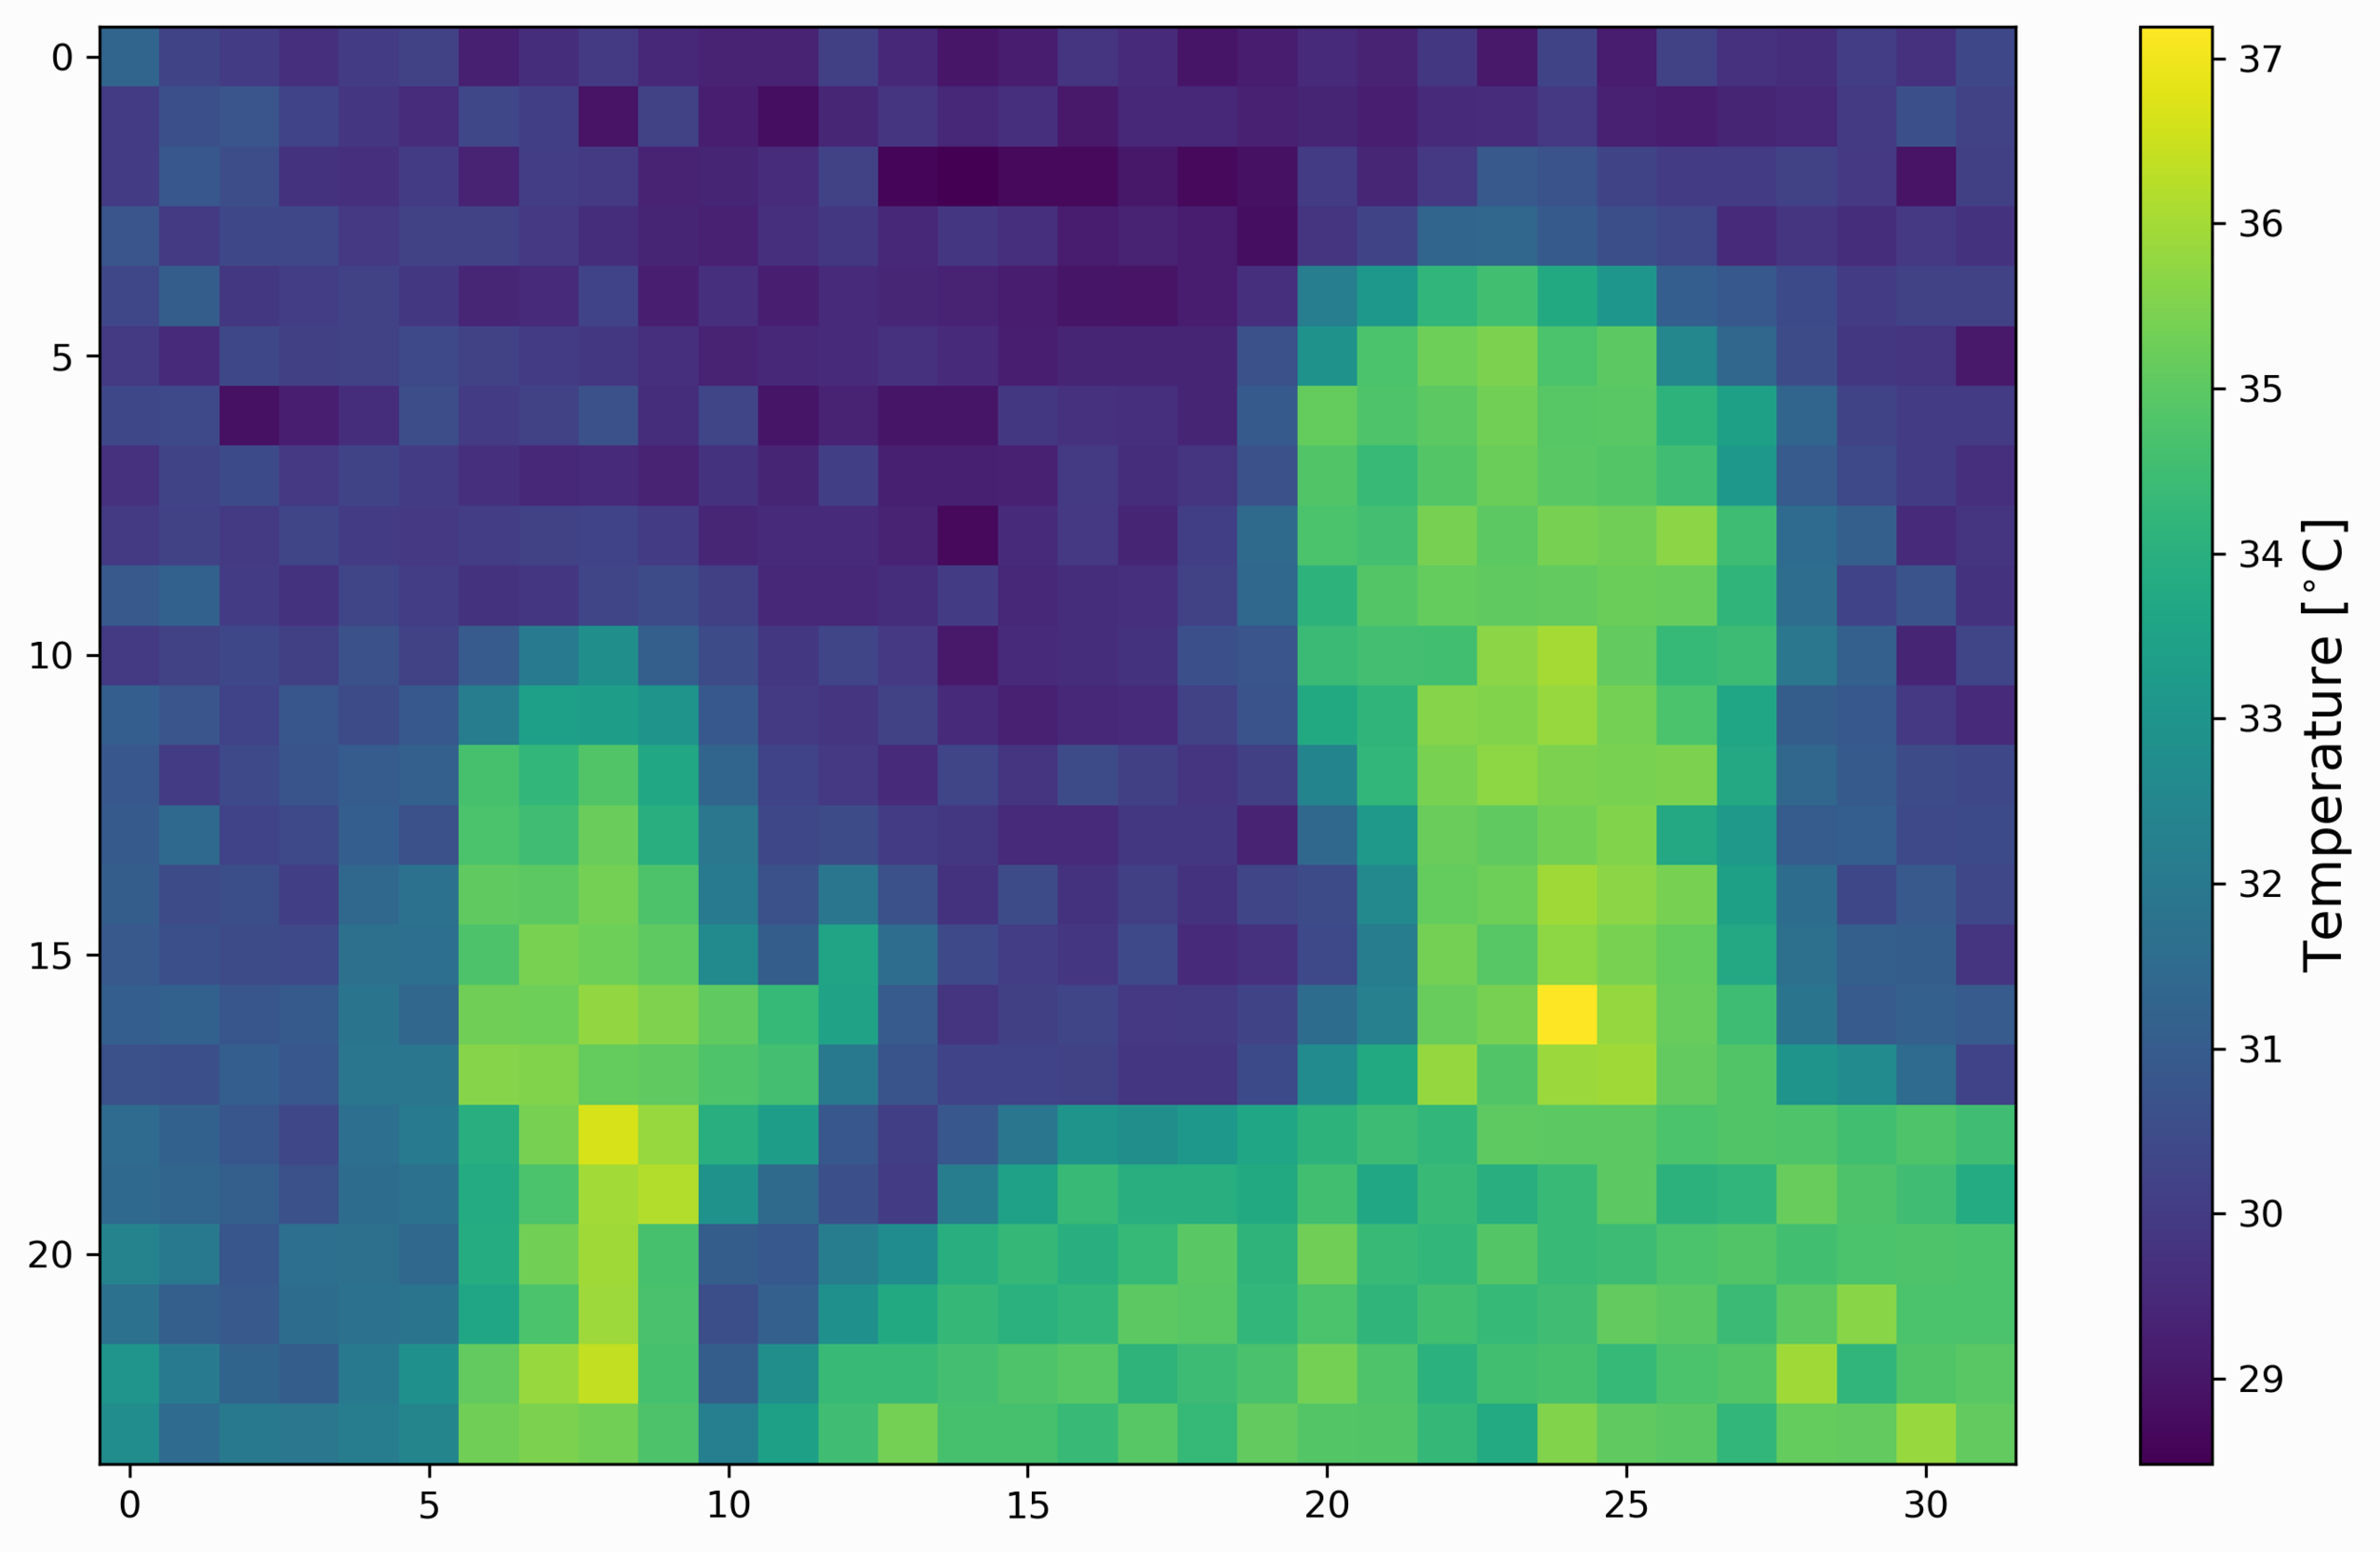
If the user comments out the saving routine, the Raspberry Pi 4 should be able to plot roughly 2 images per second (2Hz sample rate). In the next section, the development of a real-time interpolation routine is introduced.
The code produced above is a simple and quick way to plot the raw values outputted by the MLX90640 thermal array. Next, we want to both improve the resolution of the IR camera, while also improving the speed of the plotting routine. After quite a lot of testing and development - we were not able to get past roughly 3 frames per second at the new resolution. The new chosen resolution is 240x320 (76,800 pixels in total!), which, when compared to the native resolution above, is quite a jump. But since we can speed up the analysis - the new temporal sampling rate is quite good. Of course, the Raspberry Pi has its limits, particularly in this case with respect to processing the images. And perhaps if one can find a way to use a lower-quality display, the processing time could be minimized and the effective sampling rate could be increased further.
The Python library ‘scipy’ has an image processing toolbox called ‘ndimage’ which is able to interpolate images using a variety of different methods. Using the ‘zoom’ function in the ‘ndimage’ toolbox, the MLX90640’s native 24x32 output can be interpolated to 240x320 using the following addendum to the code above:
data_array = ndimage.interpolation.zoom(data_array,zoom=10)
This adjustment results in an effective frame rate of 1.6fps. This is a fairly slow frame rate, even for a thermal camera. As a result, the following codes will attempt to push the Raspberry Pi and Python to update the plot at a slightly higher frame rate.
— The first change involves invoking the ‘blitting’ method in matplotlib, which keeps the background of a matplotlib figure every loop and updates only the image section of the figure. This gives us an updated frame rate (depending on the RPI board) for the interpolated image. The code to enable ‘blitting’ is given below:
##########################################
# MLX90640 Thermal Camera w Raspberry Pi
# -- 2fps with Interpolation and Blitting
##########################################
#
import time,board,busio
import numpy as np
import adafruit_mlx90640
import matplotlib.pyplot as plt
from scipy import ndimage

i2c = busio.I2C(board.SCL, board.SDA, frequency=400000) # setup I2C
mlx = adafruit_mlx90640.MLX90640(i2c) # begin MLX90640 with I2C comm
mlx.refresh_rate = adafruit_mlx90640.RefreshRate.REFRESH_16_HZ # set refresh rate
mlx_shape = (24,32) # mlx90640 shape

mlx_interp_val = 10 # interpolate # on each dimension
mlx_interp_shape = (mlx_shape[0]*mlx_interp_val,
                    mlx_shape[1]*mlx_interp_val) # new shape

fig = plt.figure(figsize=(12,9)) # start figure
ax = fig.add_subplot(111) # add subplot
fig.subplots_adjust(0.05,0.05,0.95,0.95) # get rid of unnecessary padding
therm1 = ax.imshow(np.zeros(mlx_interp_shape),interpolation='none',
                   cmap=plt.cm.bwr,vmin=25,vmax=45) # preemptive image
cbar = fig.colorbar(therm1) # setup colorbar
cbar.set_label('Temperature [$^{\circ}$C]',fontsize=14) # colorbar label

fig.canvas.draw() # draw figure to copy background
ax_background = fig.canvas.copy_from_bbox(ax.bbox) # copy background
fig.show() # show the figure before blitting

frame = np.zeros(mlx_shape[0]*mlx_shape[1]) # 768 pts
def plot_update():
    fig.canvas.restore_region(ax_background) # restore background
    mlx.getFrame(frame) # read mlx90640
    data_array = np.fliplr(np.reshape(frame,mlx_shape)) # reshape, flip data
    data_array = ndimage.zoom(data_array,mlx_interp_val) # interpolate
    therm1.set_array(data_array) # set data
    therm1.set_clim(vmin=np.min(data_array),vmax=np.max(data_array)) # set bounds
    cbar.on_mappable_changed(therm1) # update colorbar range

    ax.draw_artist(therm1) # draw new thermal image
    fig.canvas.blit(ax.bbox) # draw background
    fig.canvas.flush_events() # show the new image
    return

t_array = []
while True:
    t1 = time.monotonic() # for determining frame rate
    try:
        plot_update() # update plot
    except:
        continue
    # approximating frame rate
    t_array.append(time.monotonic()-t1)
    if len(t_array)>10:
        t_array = t_array[1:] # recent times for frame rate approx
    print('Frame Rate: {0:2.1f}fps'.format(len(t_array)/np.sum(t_array)))
The code above uses the 10x interpolation of the ‘zoom’ function to output a 240x320 thermal image. We were able to achieve roughly a 2.2 frames per second output rate with the blitting, however, if the image is shrunk by figsize=(9,5), it runs at roughly 3.4fps, and shrinking down to figsize=(5,3) results in about 5.4fps. One thing to note is that the refresh rate of the MLX90640 must also be changed to fit the different frame rates in order to keep up with the plotting. I don’t really recommend going over REFRESH_16_HZ due to the unstable nature of the images. Another thing to note is that the colorbar likely will not update unless ‘plt.pause(0.01)’ is called, and unfortunately this slows down the frame rate. Lastly, if the ‘set_clim’ function is removed and the user is able to set the clim before the loop, this can speed up the process as well. The downside is if the temperature changes, the colormap will not reflect this, obscuring the real-time visualization. With both the colorbar and clim functions commented out, we were able to get a frame rate of about 6.2fps when figsize() is set to (5,3). This is similar to if the RPI was running on a small display instead of a monitor (we were using an HD display monitor).
The resulting interpolated live plot should appear similar to the animation below (taken directly from our MLX90640 sensor):

The animation above is similar to what is expected from the code implementation at the interpolated resolution of 240x320. The MLX90640 was being refreshed at 8Hz, meaning the maximum resolution is 8fps. The GIF above also uses roughly a 5Hz frame rate, which can roughly be seen in the animation speed.
A few notes on the MLX90640 Real-Time Thermal Camera:
- The MLX90640 reads in a chess pattern, resulting in the pixelation observed during movement
- A refresh rate above 8Hz produces a large amount of noise - thus, 8fps is the recommended upper limit
- Shrinking the size of the figure results in faster processing and plotting
- Updating the temperature and colorbar limits slow down processing
- The Raspberry Pi is limited by its CPU and GPU. Running the real-time interpolation results in roughly 85% processor usage
The MLX90640 infrared thermal camera was introduced as a tool for visualizing the spatial distribution of temperatures across 768 (24x32) pixels. Using a Raspberry Pi, the MLX90640, and Python, a real-time temperature map was developed that operates at roughly 3-8 frames per second. The frame rate is limited by the CPU and GPU on the Raspberry Pi 4, where the upper limit of 8fps corresponds to a smaller figure display on the RPI. The thermal camera was further improved by interpolating pixels to 240x320, resulting in a smoother depiction of the temperature map. The thermal camera methods introduced in this tutorial have potential applications in non-destructive testing or experiments where distributed temperature maps are desired. Specific applications may be: electronics cooling, monitoring of moving parts with high frictions, and perhaps monitoring bodies for security or tracking. An infrared camera is particularly suitable for environments in low light because of the consistentcy of infrared radiation given off by bodies. Lastly, the MLX90640 IR sensor is a low-cost and efficient solution to monitoring spatial distributions of temperature, particularly for applications involving open-source tools that include Python, Arduino, and the Raspberry Pi platforms.
See More in Raspberry Pi and Engineering: