Posts tagged Python Visualization
Calibration of a Magnetometer with Raspberry Pi

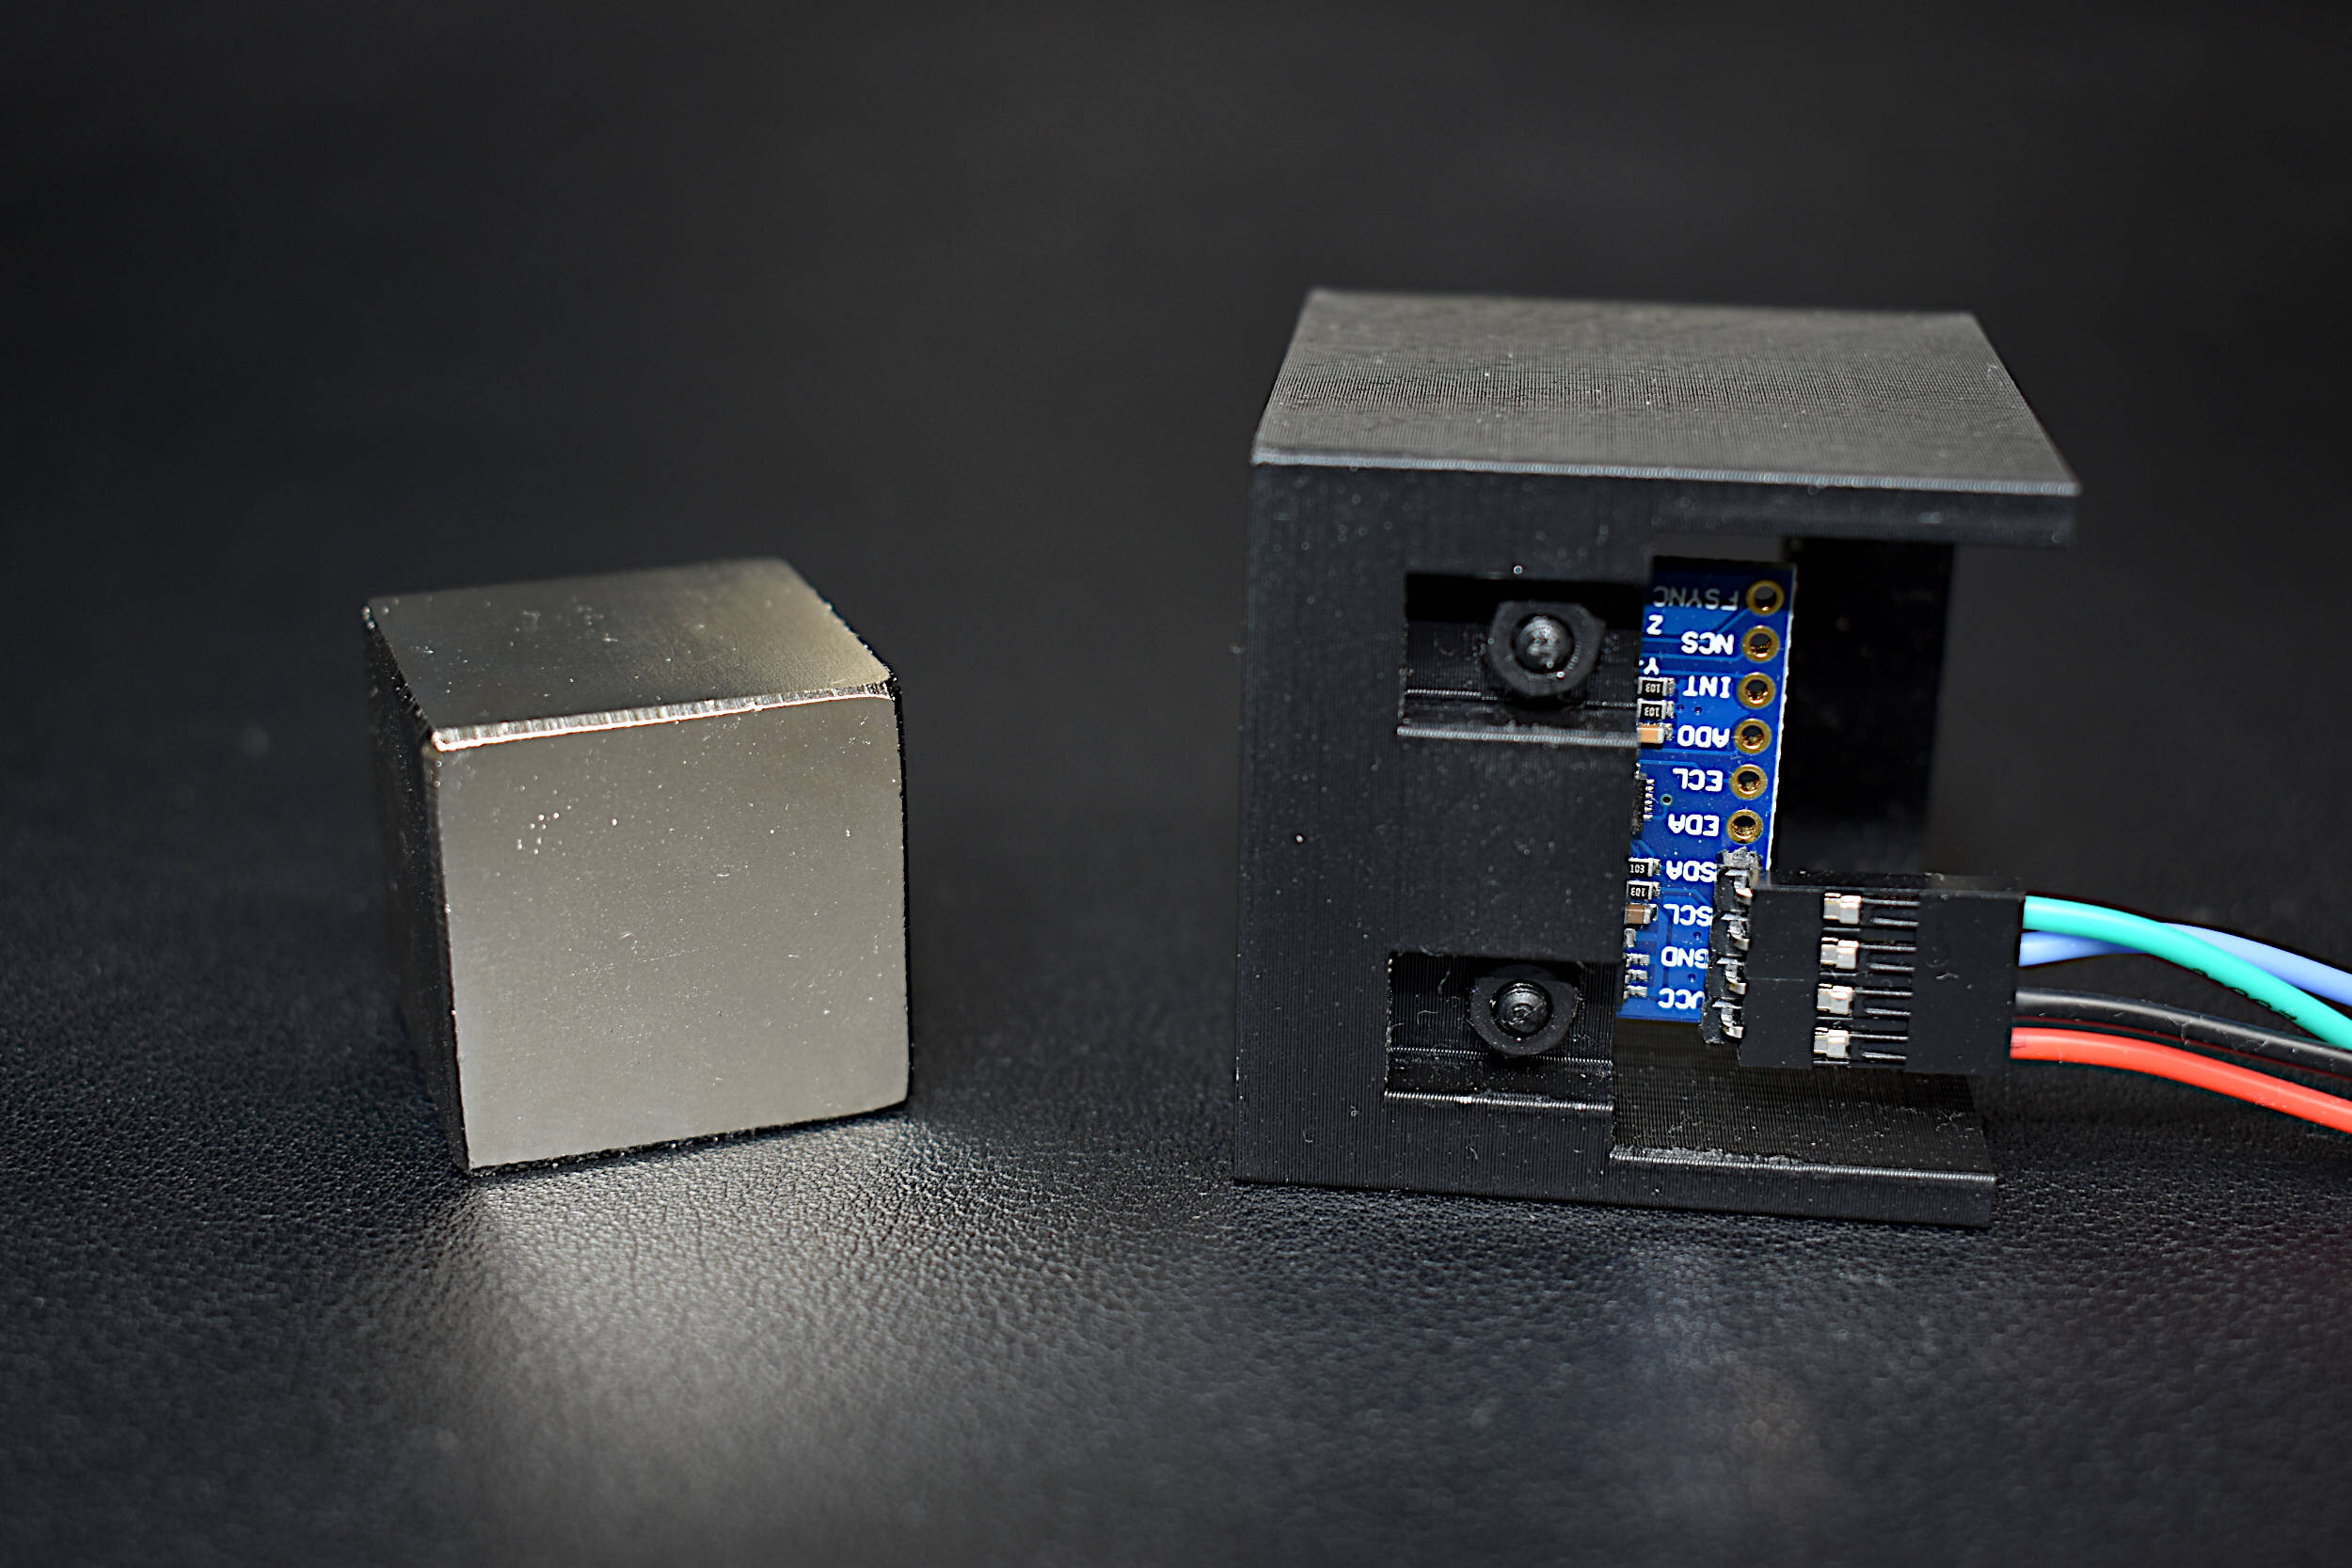
In this tutorial, methods for calibrating a magnetometer aboard the MPU9250 is explored using our Calibration Block. The magnetometer is calibrated by rotating the IMU 360° around each axis and calculating offsets for hard iron effects. Python is again used as the coding language on the Raspberry Pi computer in order to communicate and record data from the IMU via the I2C bus. The second half of this tutorial gives a full calibration routine for the IMU's accelerometer, gyroscope, and magnetometer. The final implementation will allow for moderate (first-order) calibration of the MPU9250 under reasonable conditions, requiring only the calibration block and IMU. Finally, the complete final code will save the coefficients for each sensor for future use in direct applications without the need for constant calibration. The use of the calibration coefficients will allow for improved estimates of orientation, displacement, vibration, and other relevant control and measurement analyses.

Read More
Recording Stereo Audio on a Raspberry Pi

The INMP441 MEMS microphone is used to record audio using a Raspberry Pi board through the inter-IC sound (I2S or I2S) bus. The I2S standard uses three wires to record data, keep track of timing (clock), and determine whether an input/output is in the left channel or right channel. First, the Raspberry Pi (RPi) needs to be prepped for I2S communication by creating/enabling an audio port in the RPi OS system. This audio port will then be used to communicate with MEMS microphones and consequently record stereo audio (one left channel, one right channel). Python iS then used to record the 2-channel audio via the pyaudio Python audio library. Finally, the audio data will be visualized and analyzed in Python with simple digital signal processing methods that include Fast Fourier Transforms (FFTs), noise subtraction, and frequency spectrum peak detection.

Read More
Geographic Visualizations in Python with Cartopy

Cartopy is a cartographic Python library that was developed for applications in geographic data manipulation and visualization. It is the successor to the the Basemap Toolkit, which was the previous Python library used for geographic visualizations. Cartopy can be used to plot satellite data atop realistic maps, visualize city and country boundaries, track and predict movement based on geographic targeting, and a range of other applications relating to geographic-encoded data systems. In this tutorial, Anaconda 3 will be used to install Cartopy and related geographic libraries. As an introduction to the library and geographic visualizations, some simple tests will be conducted to ensure that the Cartopy library was successfully installed and is working properly. In subsequent tutorials: shapefiles will be used as boundaries, realistic city streets will be mapped, and satellite data will be analyzed.

Read More
Visualizing COVID-19 Data in Python

This blog post is aimed at creating meaningful visualizations that may or may not be available elsewhere, while instructing users on how to source, analyze, and visualize COVID-19 infection case and rate data using Python. All of the data used herein is publicly available for anyone interested in replicating the figures, with code and links where necessary. The methods used here have been uniquely conceived and developed by Maker Portal, and in no way reflect preferred methods of either the government or any other private entities. Several Python toolboxes will be implemented below, and it is recommended that users install and verify their functionality before attempting to replicate the forthcoming figures.

Read More
Google Trends x Yahoo Finance Analysis in Python

Python has a multitude of libraries dedicated to scraping the internet in various ways. For example, Google Trends is a product produced by Google that analyzes search history and publishes the popularity of search terms over time. One user created an algorithm to pull trend data from Google using Python in a package called pytrends. Another such library uses Python to pull stock information from Yahoo Stocks in a package called yfinance. Both of these libraries will be used to plot and compare finance and trend data over time using Python scripts. The methods outlined in this tutorial could be applied to areas in finance, data analytics, and data visualization in general.

Read More
Python FTP for Data Mining and Analysis

Python’s file transfer protocol (FTP) library is used to parse weather station data from the publicly available automated surface observing system (ASOS) from the U.S.A.’s National Climatic Data Center (NCDC). Several programmatic tools available in Python are used to automate the parsing of weather data, as well as visualizing the resulting data.

Read More
GOES-R Satellite Latitude and Longitude Grid Projection Algorithm

Calculating latitude and longitude from a GOES-R L1b data file. The GOES-R L1b radiance files contain radiance data and geometry scan information in radians. This information is not enough to plot geographic radiance data right from the file, however, after some geometric manipulation harnessing satellite position and ellipsoid parameters, we can derive latitude and longitude values from the one-dimensional scan angles and plot our data in projected formats familiar to many geographic information tools.

Read More
How to Create a Rotating Globe Using Python and the Basemap Toolkit